CU Boulder · EVEN 2909 · En-ROADS Climate Simulation Lab
← Course Home

Climate Change: Approaches and Solutions

En-ROADS Climate Simulation Lab · EVEN 2909: Introduction to Global Sustainability · Week 5

Whitney Knopp, PhD Candidate, Environmental Engineering · Tue Sep 15, 2026

Keys: S toggles these notes, F fullscreen, Esc opens the slide overview.

Where Are We?

Last week we covered the planetary boundaries. This week we focus on one of them: climate change.

Climate Change
Atmospheric CO2
Biosphere Integrity
Extinction rate, human portion of NPP
N & P Cycles
Mined P, N fixation in agriculture
Land-System Change
Forest cover remaining
Novel Entities
Synthetic chemicals released without testing
Freshwater Change
Land area with blue water and green water deviation
Ocean Acidification
Mean surface aragonite saturation
Atmospheric Aerosols
Interhemispheric difference in aerosol optical depth
Ozone Depletion
Global stratospheric O3 column

Planetary Boundary: Climate Change

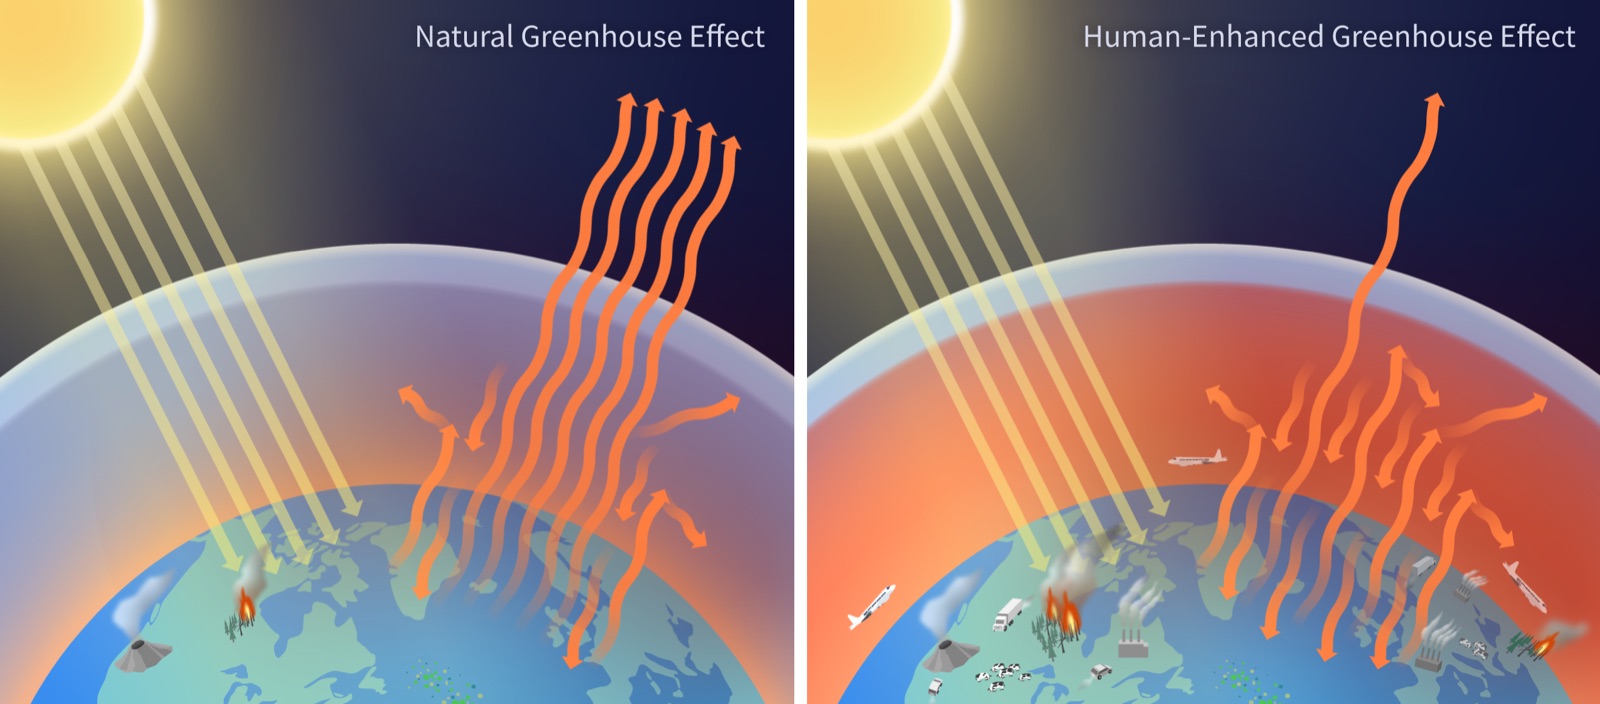
Why do we care about CO2 and other greenhouse gases? They drive the greenhouse effect.

  • Control variable: atmospheric CO2 (equivalent) concentration, and radiative forcing.
  • Radiative forcing: the net change in solar energy absorbed by Earth versus radiated back to space, in W/m2 [1].
Atmospheric CO2eq (ppm)Radiative forcing (W/m2)
Boundary (IPCC)350+1
Current level423+2.97
Diagram of the greenhouse effect
Figure 1. The greenhouse effect. Source: NOAA Climate.gov [2]

The Carbon Budget

Cumulative global CO2 emissions track global temperature rise in a straight line.
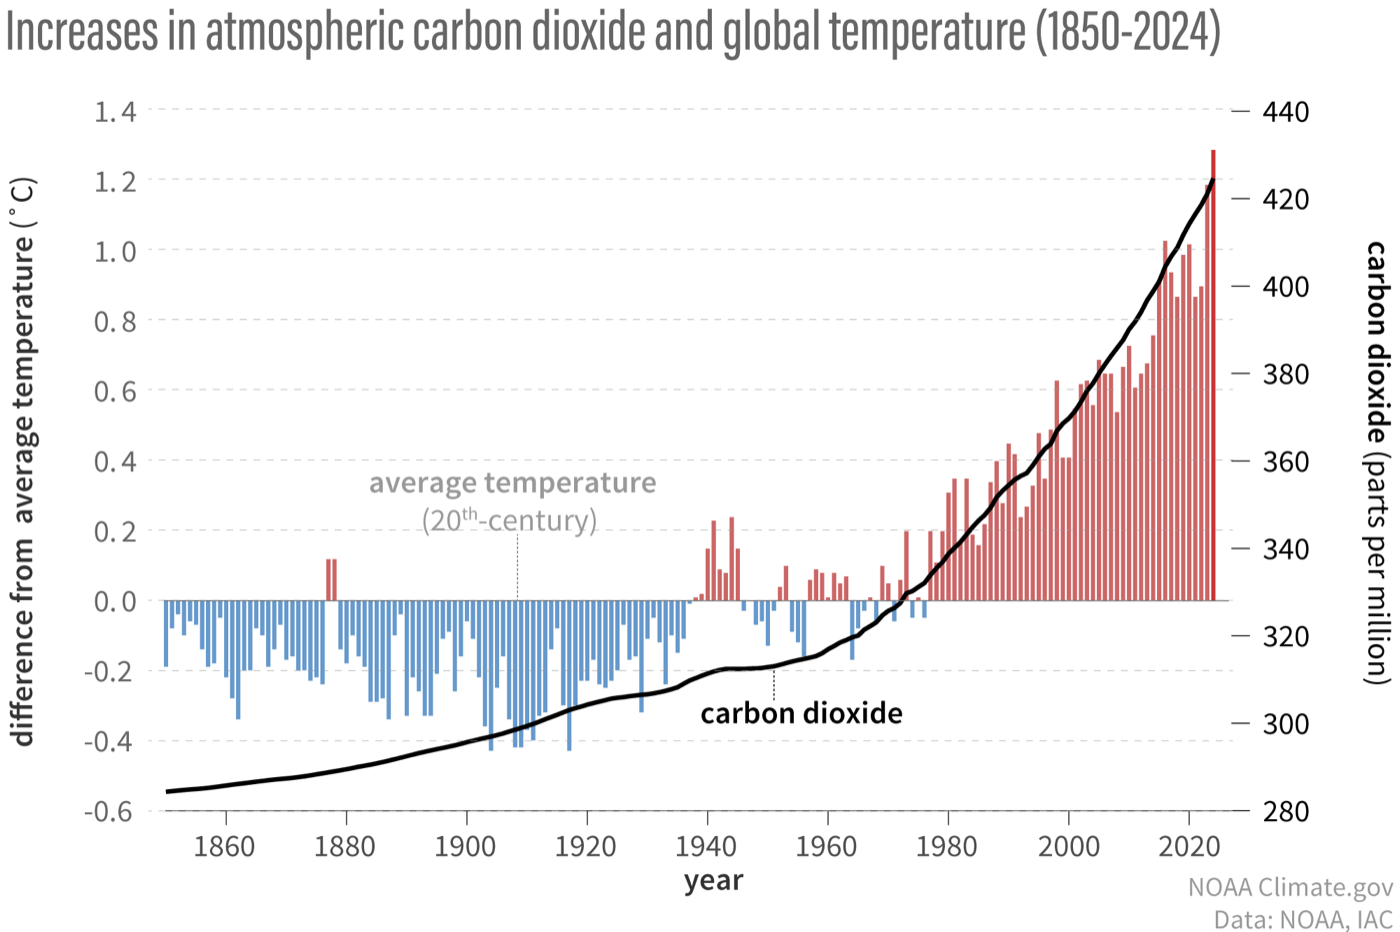
Cumulative CO2 emissions plotted against global average temperature change
Figure 2. Global CO2 versus change in global average temperature. Source: NOAA Climate.gov [3]

To limit warming we have to reduce emissions and remove CO2 that is already in the atmosphere.

CO2 Emissions by Sector

Where can we make the biggest impact? Start with the sectors that produce the emissions.

73%
Energy (electricity, heat, transport, buildings)
18%
Agriculture & land use
5%
Industrial processes
3%
Waste

Table 1. Global greenhouse gas emissions by sector. Source: EVEN 2909 Climate Science slides [4]

Emissions in the Energy Sector

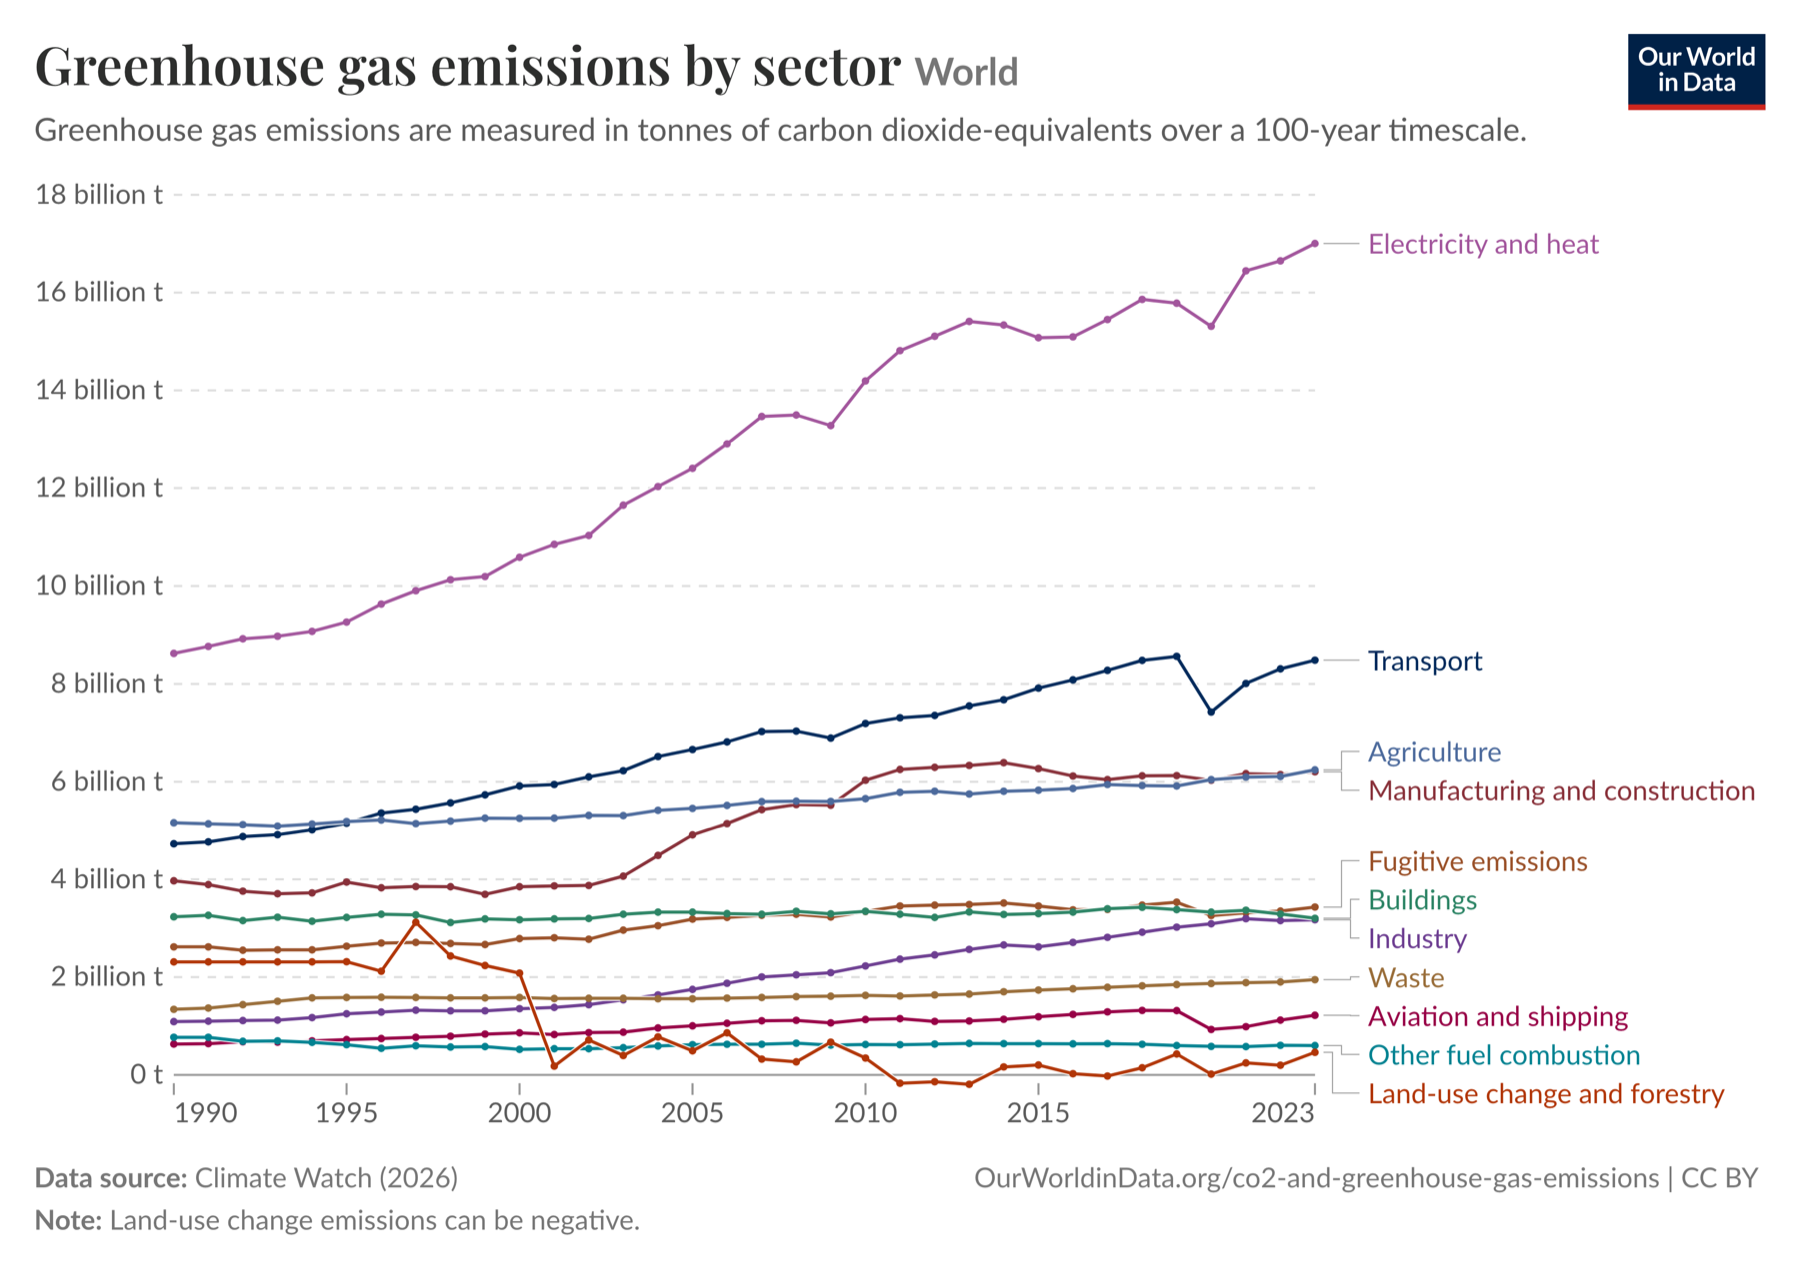
Share of total emissions (energy is 73% of the total):

  • Electricity & heat production: 30%
  • Transportation: 16%
  • Manufacturing & construction: 12%
  • Buildings: 6%
  • Other energy: 9%
Our World in Data chart of global greenhouse gas emissions by sector
Figure 3. Global greenhouse gas emissions by sector. Source: Our World in Data [5]
The Lab

The En-ROADS Climate Simulator

Designing policy scenarios that limit warming

En-ROADS Introduction

En-ROADS is a climate simulation tool built by Climate Interactive and the MIT Sloan Sustainability Initiative [6].

What is it used for?

  • Understanding how different policy scenarios change CO2 emissions and global temperature over time.
  • Decision-making, modeling, planning and advocacy.

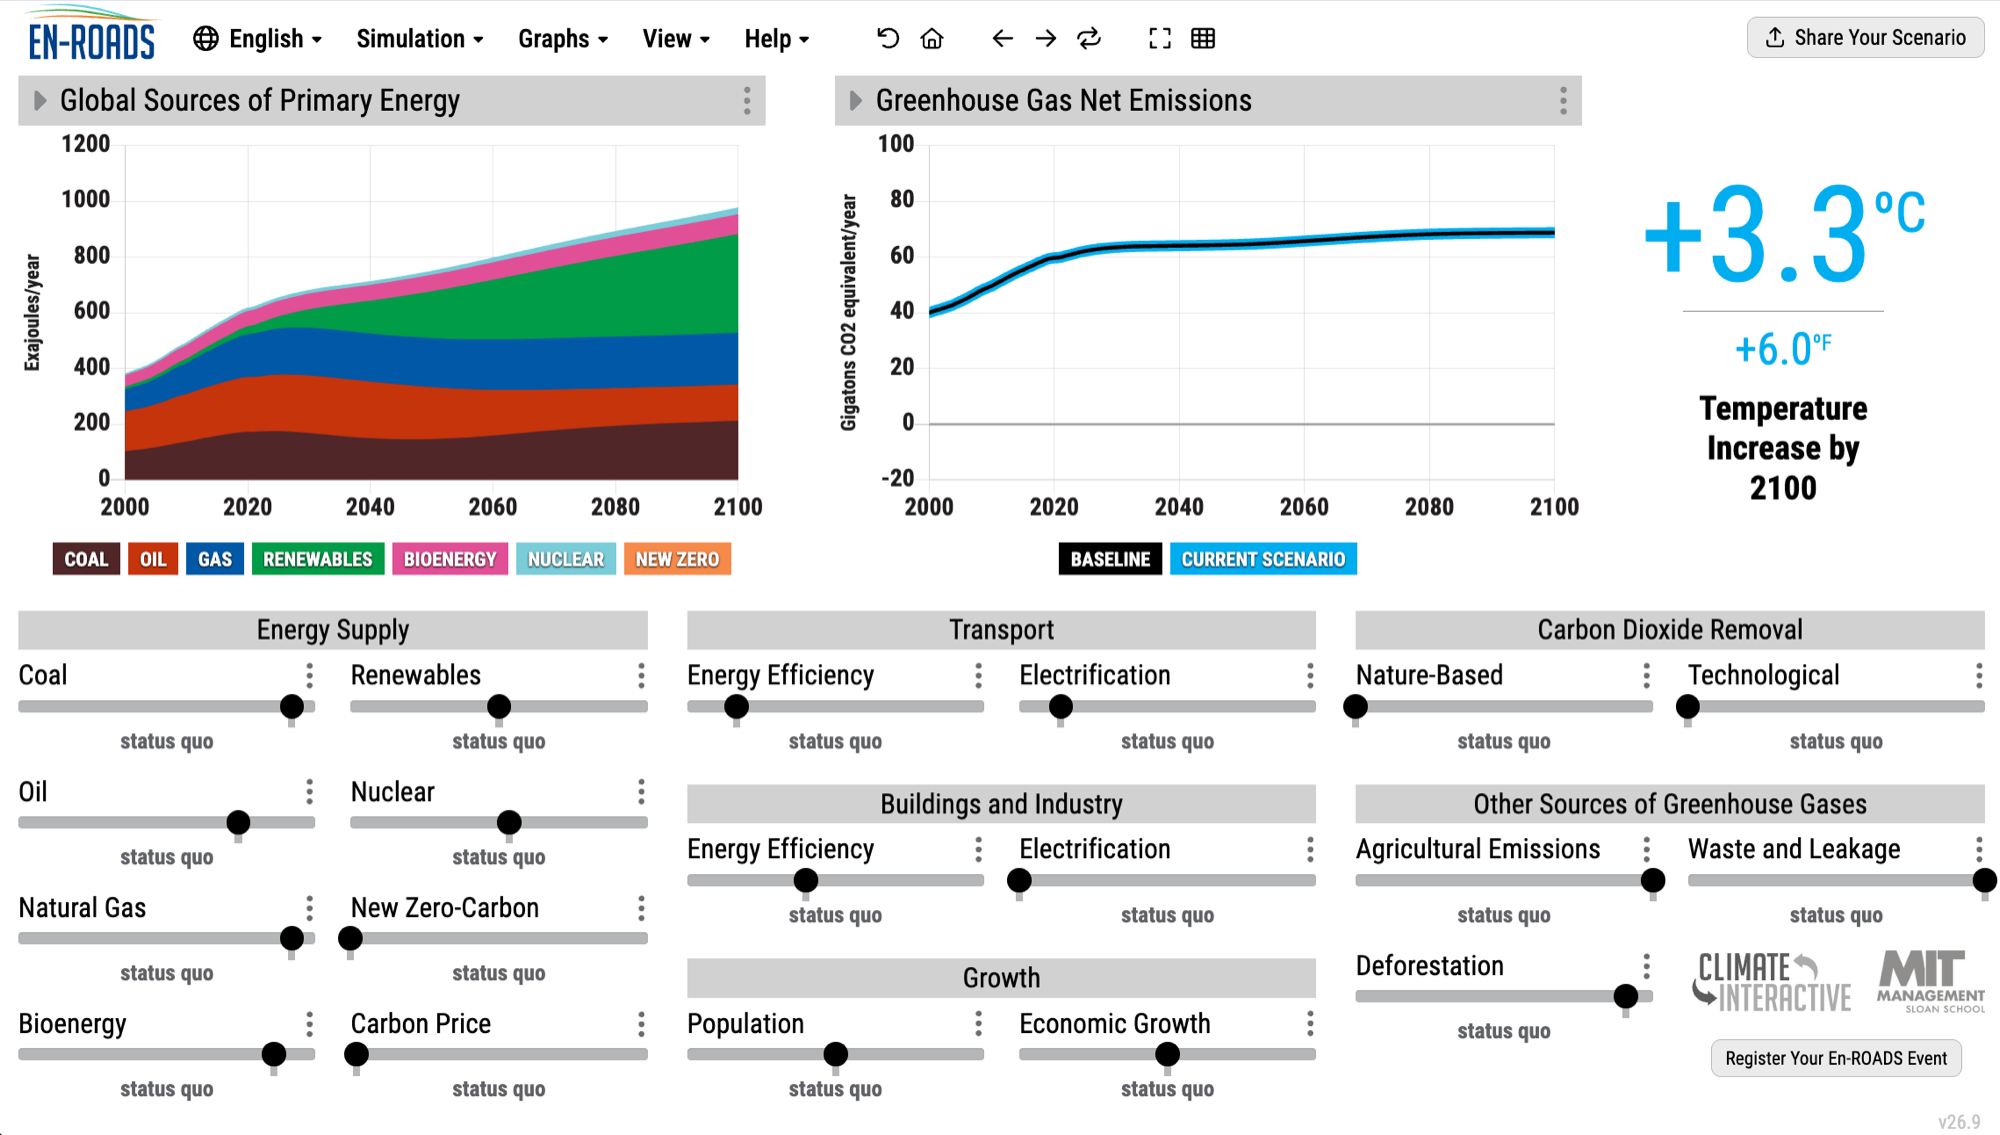
En-ROADS Overview

The En-ROADS main interface with policy sliders and graphs
Other graphs to investigate: impacts beyond temperature
Save & share your scenario
Target to modify: temperature in 2100
Levers you can change

En-ROADS Walk-Through

The simulator has many levers. Main categories: energy supply, transportation, buildings and industry, growth, carbon dioxide removal, and other greenhouse gas sources.

Consider five goals at once:

1
Climate
Limit warming to <2°C
2
Economy
Preserve and create a healthy economy
3
Equity
Promote equity and a just transition
4
Environment
Protect the environment
5
Realism
Be realistic but not cynical

En-ROADS Example

  1. Select a component to change. I will choose Energy.
  2. Use the slider, or set a value manually for finer control.
  3. Click the “i” button for more information on each lever.
  4. Look at the different graphs. What do they mean?

In your assignment, describe what your graphs mean.

Live demo in the simulator.

En-ROADS Assignment

Goal: create a set of policies that limits global warming to 2°C. Consider every dimension: social, environmental, economic and logistical.

The report includes:

  • Write-up design: group plan name, En-ROADS interface screenshot, the key policies your group selected, the Actions & Outcomes text pasted from the simulator, the scenario URL, and graphs (optional).
  • Meeting the goals: answer the questions for each of the five goals.
  • Reflections and conclusions: answer the reflection questions.

Full instructions and rubric on the lab page

What’s Next?

Rest of today, Tue 9/15

Work on the En-ROADS assignment in your groups. Carlo and Whitney are here to help.

Thursday 9/17

In-class discussion of current approaches, then work time.

Reminders

  • En-ROADS assignment due Monday 9/21, 11:59 pm. The rubric is on Canvas.
  • Buy or download The Divide by Jason Hickel. Part 1 is due before class.

Thanks! Questions?

whitney.knopp@colorado.edu · Office hours by appointment · SEEC C260 and N290