Trail bridges, rural isolation and a randomized trial in Rwanda
EVEN 2909
1 min. This is our own study, with Wyatt Brooks (Arizona State) and Kevin Donovan (Yale), and Denis Muthike, Lambert Mugabo and Laura MacDonald at the Mortenson Center. The household results are from the Nature Communications manuscript in revision; the land and market results are from a companion working paper by the same team and are preliminary. Numbers may change slightly before publication. Keys: S notes, R reveal, F fullscreen, Esc overview.
By the End of This Lecture
You should be able to:
Explain why river crossings isolate rural households, why that is getting worse, and why many of those rivers are missing from maps.
Describe how a stepped-wedge randomized trial measures the effect of infrastructure that every site eventually receives.
Read a forest plot of effects and say which results are distinguishable from zero.
Compute an economic rate of return, and explain why it depends on how many households a bridge serves.
State what the study can and cannot tell a government deciding where to build next.
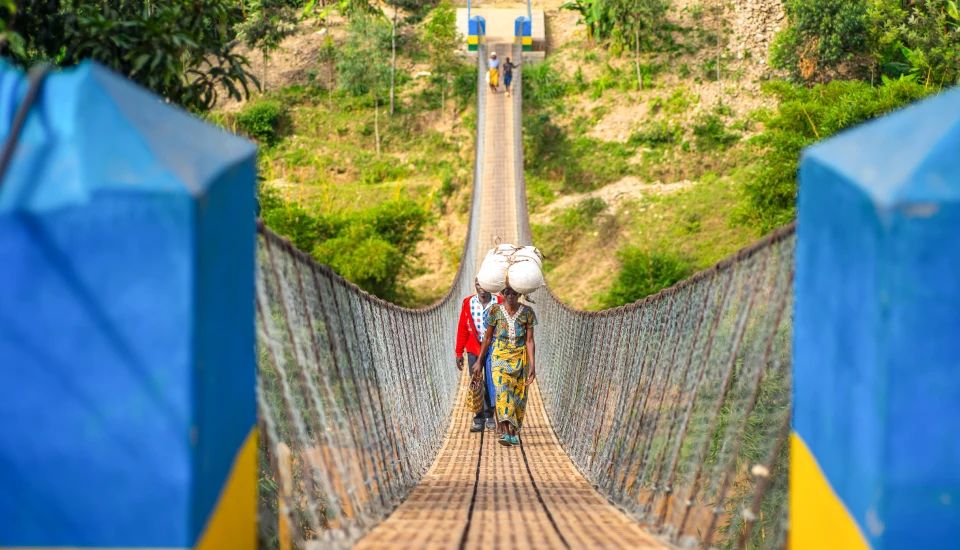
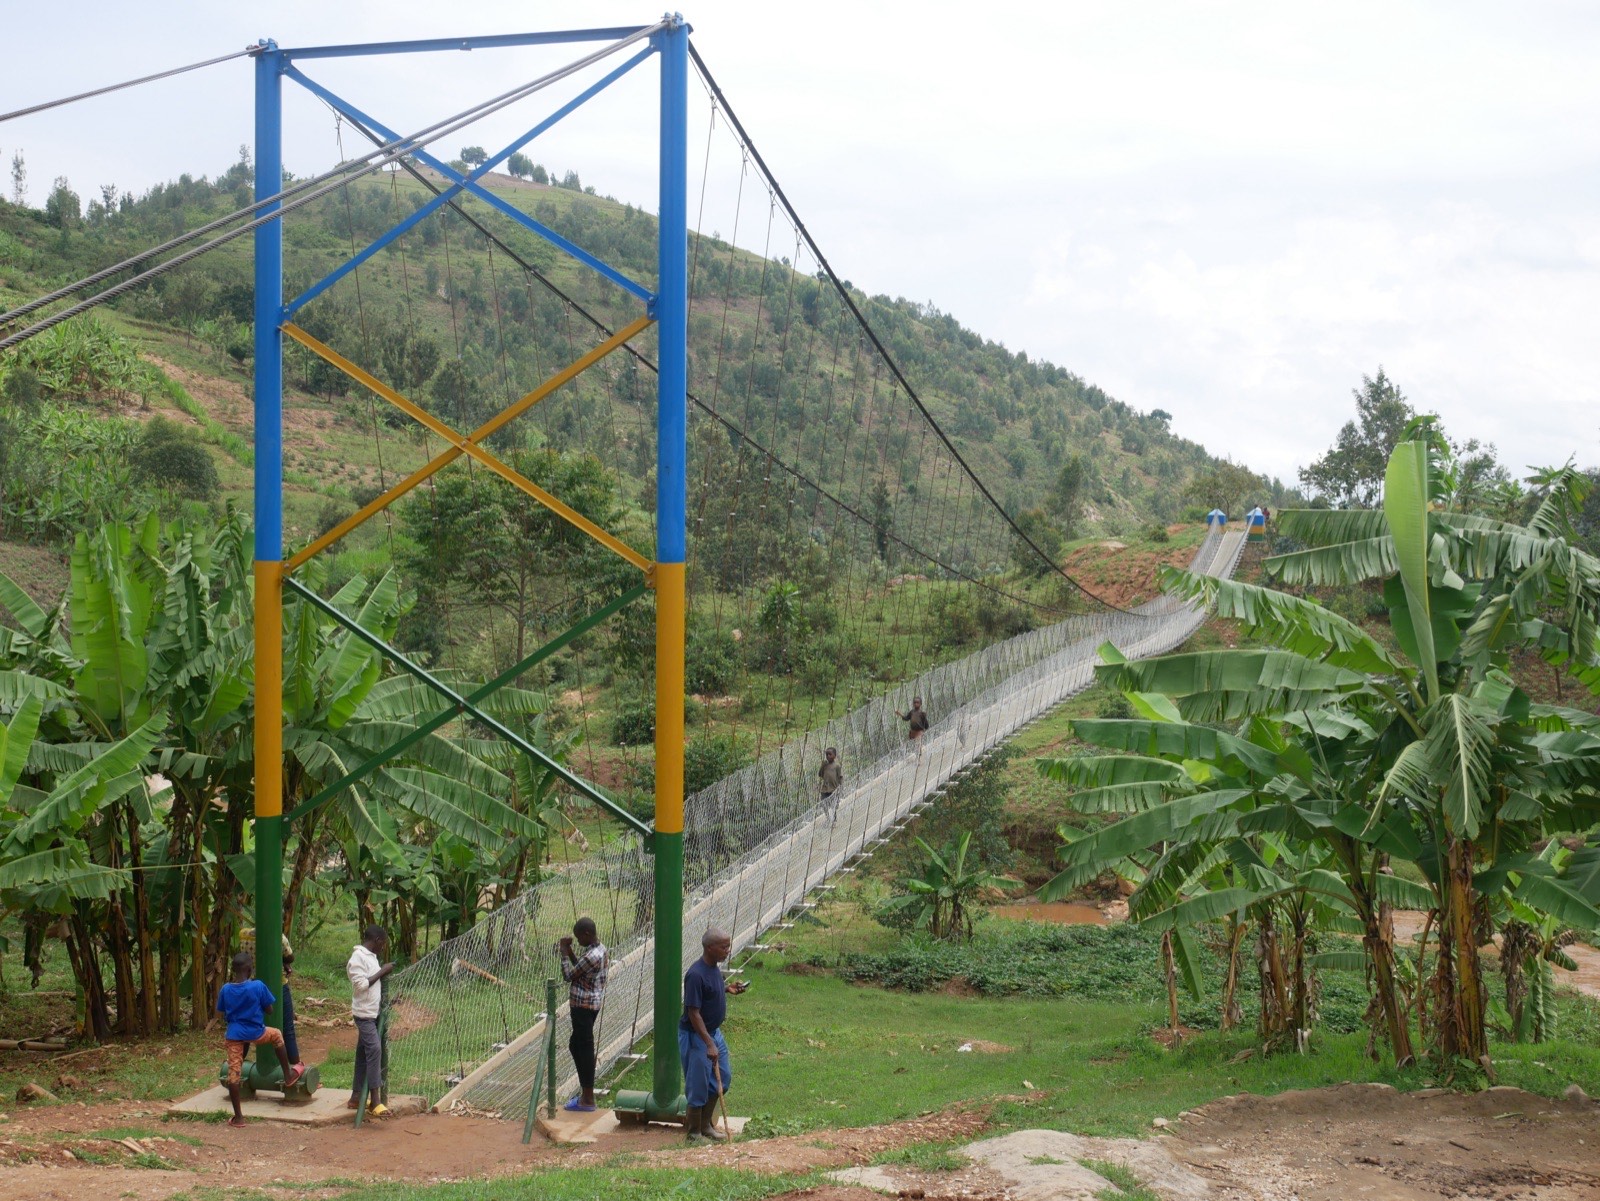
Photo: Fika.
1 min. Two activities need a spreadsheet (slide on choosing a site). Ask students to have one open, or do the arithmetic at the board.
Photo: Robb Hohmann / Fika, Gahira bridge, Rwanda
Part 1
Cut Off by a River
Who infrastructure spending reaches, and who it misses
Where Infrastructure Money Goes
$72.6B
Official international support for infrastructure in developing countries, 2022 (constant 2024 USD)
>80%
Rwandans who live in rural, hilly farming communities
Most of that spending goes to cities and major roads, where each dollar reaches more people. Isolated rural households are usually the last to be connected.
First-mile infrastructure is the footpath, river crossing or track between a household and the nearest road, market, school or clinic. Few studies have measured what it does for the households it connects.
Sources: Our World in Data (2025), International financial support to infrastructure (SDG 9.a.1); Kaiser & Barstow (2022), Sustainability 14:2149; Thomas et al. (2026), manuscript in revision.
2 min. The $72.6 billion is official development assistance plus other official flows for infrastructure, 2022. Ask: if you ran a development bank and wanted the most people served per dollar, where would you build? That logic is why remote places wait.
A River Between Home and Everything Else
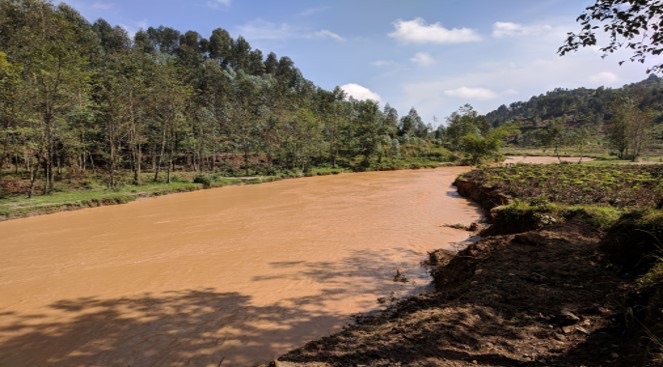
A river in rural Rwanda. Photo: Brooks, Donovan et al., working paper (2026).
In Rwanda’s hills, villages on opposite banks farm, trade and go to school across the same river.
Without a bridge, people wade or walk to the nearest crossing. Crops and fertilizer can be ruined by the water. When rivers flood, villages lose their route to schools, clinics, markets and their own fields.
Flooding brings soil erosion, crop failure, injuries and drownings, and it is becoming more frequent as rainfall intensifies.
Sources: Thomas et al. (2026), manuscript in revision; Macharia et al. (2023), Frontiers in Climate 5:1158186.
2 min. Ask the room: how far is the nearest bridge from where you live?
Rivers Are Rising
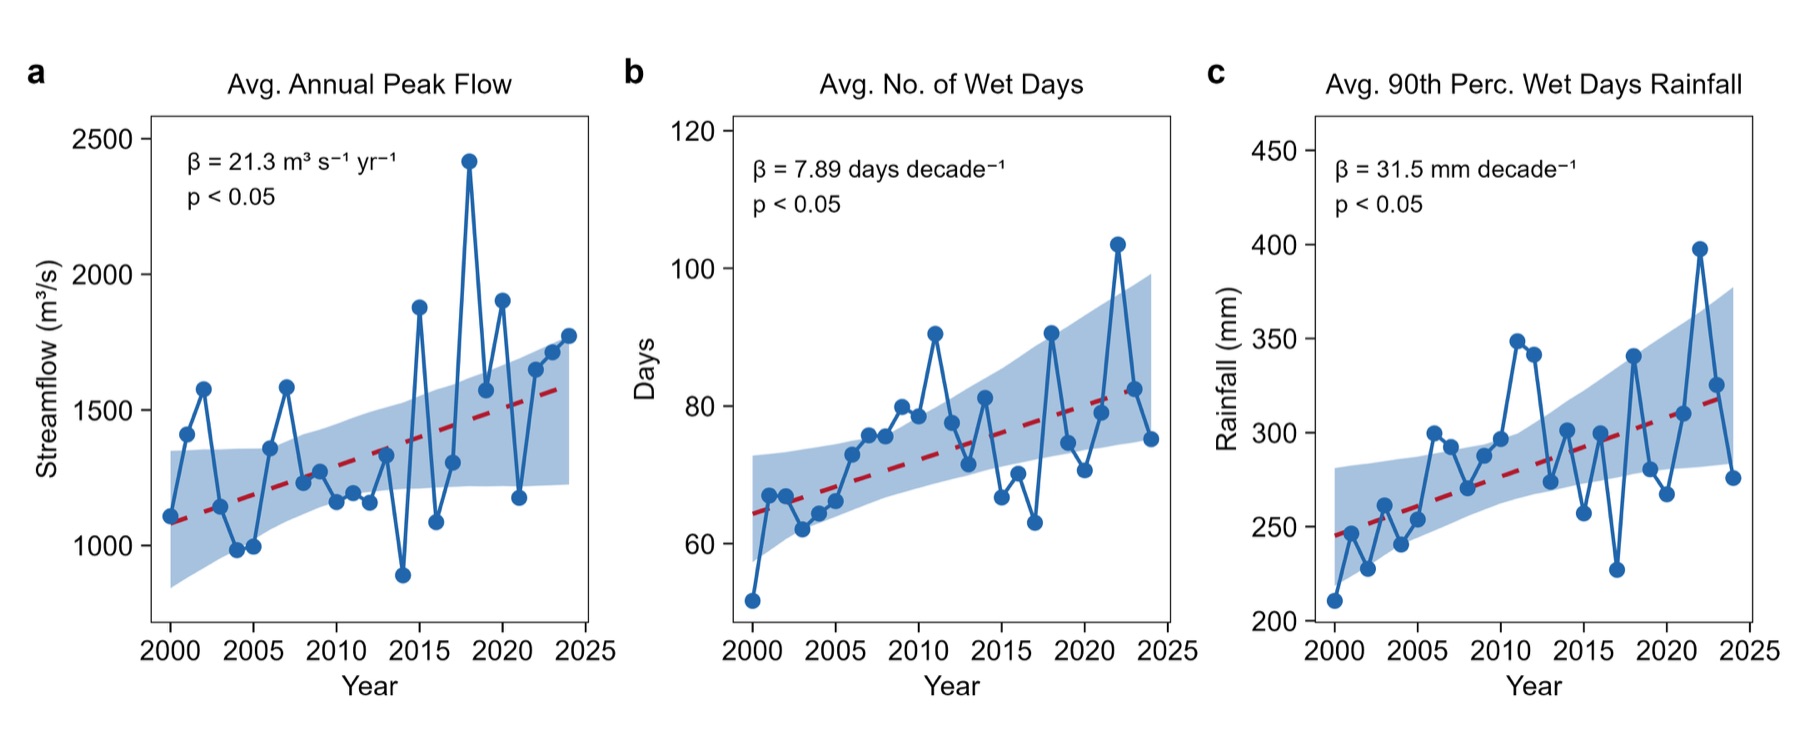
Averages across the study bridge sites, 2000–2024, with Theil–Sen trend lines and 95% bands.
Peak streamflow
Up 21.3 m³/s per year.
Wet days
About 8 more per decade.
Heavy rainfall
90th-percentile wet-day rainfall up 31.5 mm per decade.
A crossing that was passable most of the year in 2000 floods more often now. The study did not measure days when crossings were impassable, so it cannot say whether the bridges helped more in wetter places.
Source: Thomas et al. (2026), manuscript in revision, Figure 3; method from Macharia et al. (2023).
2 min. All three trends have p < 0.05 (Mann–Kendall). Other Rwandan studies attribute rising runoff to land-use change as well as rainfall. This is the adaptation side of transportation: infrastructure that keeps working as the climate changes.
Many of These Rivers Are Not on the Map
38%
of nearly 5,000 river crossings Fika assessed were on waterways missing from maps (over 60% in some countries)
54M → 179M km
Waterways mapped worldwide before and after WaterNet
Earlier global river maps relied mainly on elevation data and miss many small and seasonal streams. In a six-country sample of community bridge requests, about 60% were on the two smallest classes of stream. A government cannot plan bridges, or count who is cut off, at rivers no map shows.
WaterNet, a deep-learning model from CU Boulder’s Better Planet Laboratory built with Fika, reads Sentinel-2 satellite imagery and elevation to draw waterways at 20 m resolution. The data are open (CC BY 4.0).
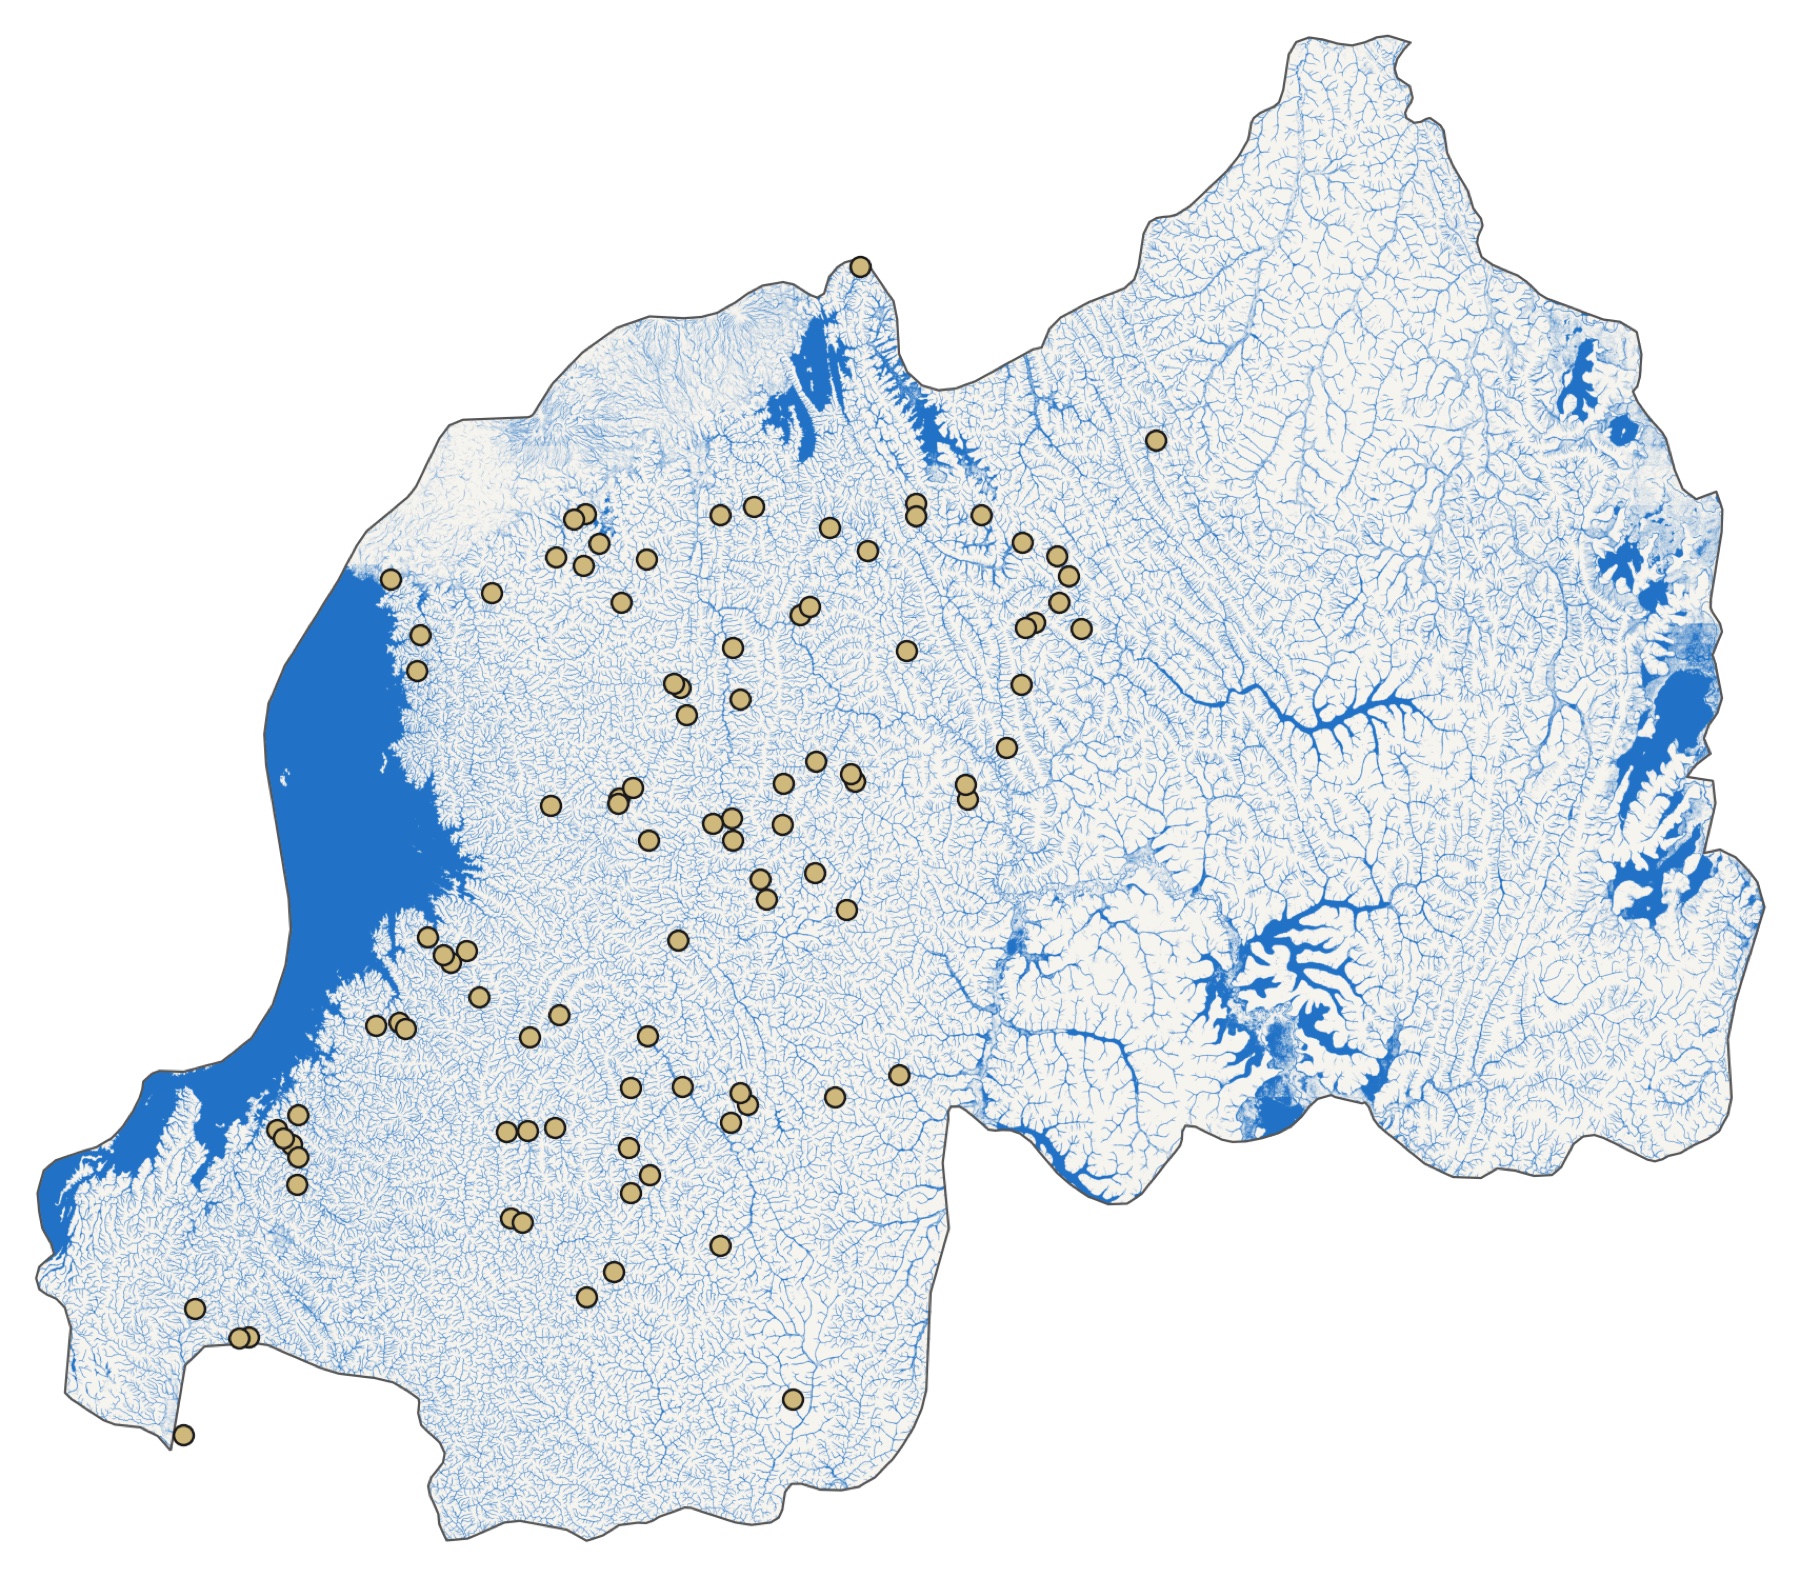
WaterNet waterways in Rwanda (darker blue = higher probability) with the 97 study bridges (gold). Rendered from the WaterNet Global Waterways dataset, Fika / Better Planet Laboratory, CC BY 4.0.
Sources: Kruse (2024), WaterNet: AI-powered global water mapping triples known waterways, Fika blog; Pierson & Mehrabi (2024), Mapping waterways worldwide with deep learning, arXiv:2412.00050.
3 min. WaterNet adds about 124 million km of waterways to the 54 million km in TDX-Hydro, the previous global standard, more than tripling the mapped total. Many of the newly mapped waterways are likely intermittent or seasonal. The model was trained only on US hydrography data and tested in the US (F1 about 0.72 with a thickness-tolerant score), so accuracy elsewhere is checked against field data such as Fika’s crossing assessments. Rwanda is one of the better-mapped cases: in our own check, OpenStreetMap already has a waterway within 100 m of 96 of the 97 study bridges, and Rwanda’s sites came from a nationwide field assessment. The mapping gap matters most for finding sites where no one has looked yet. The “about 60%” on the slide: the paper reports 25% of requests on first-order and 35% on second-order streams in one place, and 27% and 36% in another.
Photo: Fika (Bridges to Prosperity), Cyabami bridge under construction, Rwanda
Part 2
The Bridges
97 trail bridges and the communities around them
Trail Bridges
One of the 97 study bridges (Nyakabande–Bitaba), Rwanda. Figure 1 of the manuscript.
The program
The Government of Rwanda and Fika (formerly Bridges to Prosperity) set out to build several hundred trail bridges in four of the five provinces. The study covers 97 of them.
The bridges
Suspended and suspension footbridges, 38 to 156 m long (median 75 m). They carry people, livestock and motorcycles, not cars. Median build time was 98 days, at about $100,000 each, with community members providing much of the unskilled labor.
After handover
Each bridge belongs to the government; district governments maintain it.
Source: Thomas, Brooks, Donovan, Muthike, Mugabo & MacDonald (2026), Bridge building: first-mile transportation infrastructure yields disproportionate gains for isolated communities in Rwanda, manuscript in revision.
3 min. Of the 97 bridges, 74 are suspended, 19 suspension and 4 hybrid. Each bridge is designed by engineers to stay in service for over 40 years and to withstand floods; that permanence matters because farmers plant crops and rent land on the expectation that the crossing will still be there.
Three Kinds of Trail Bridge
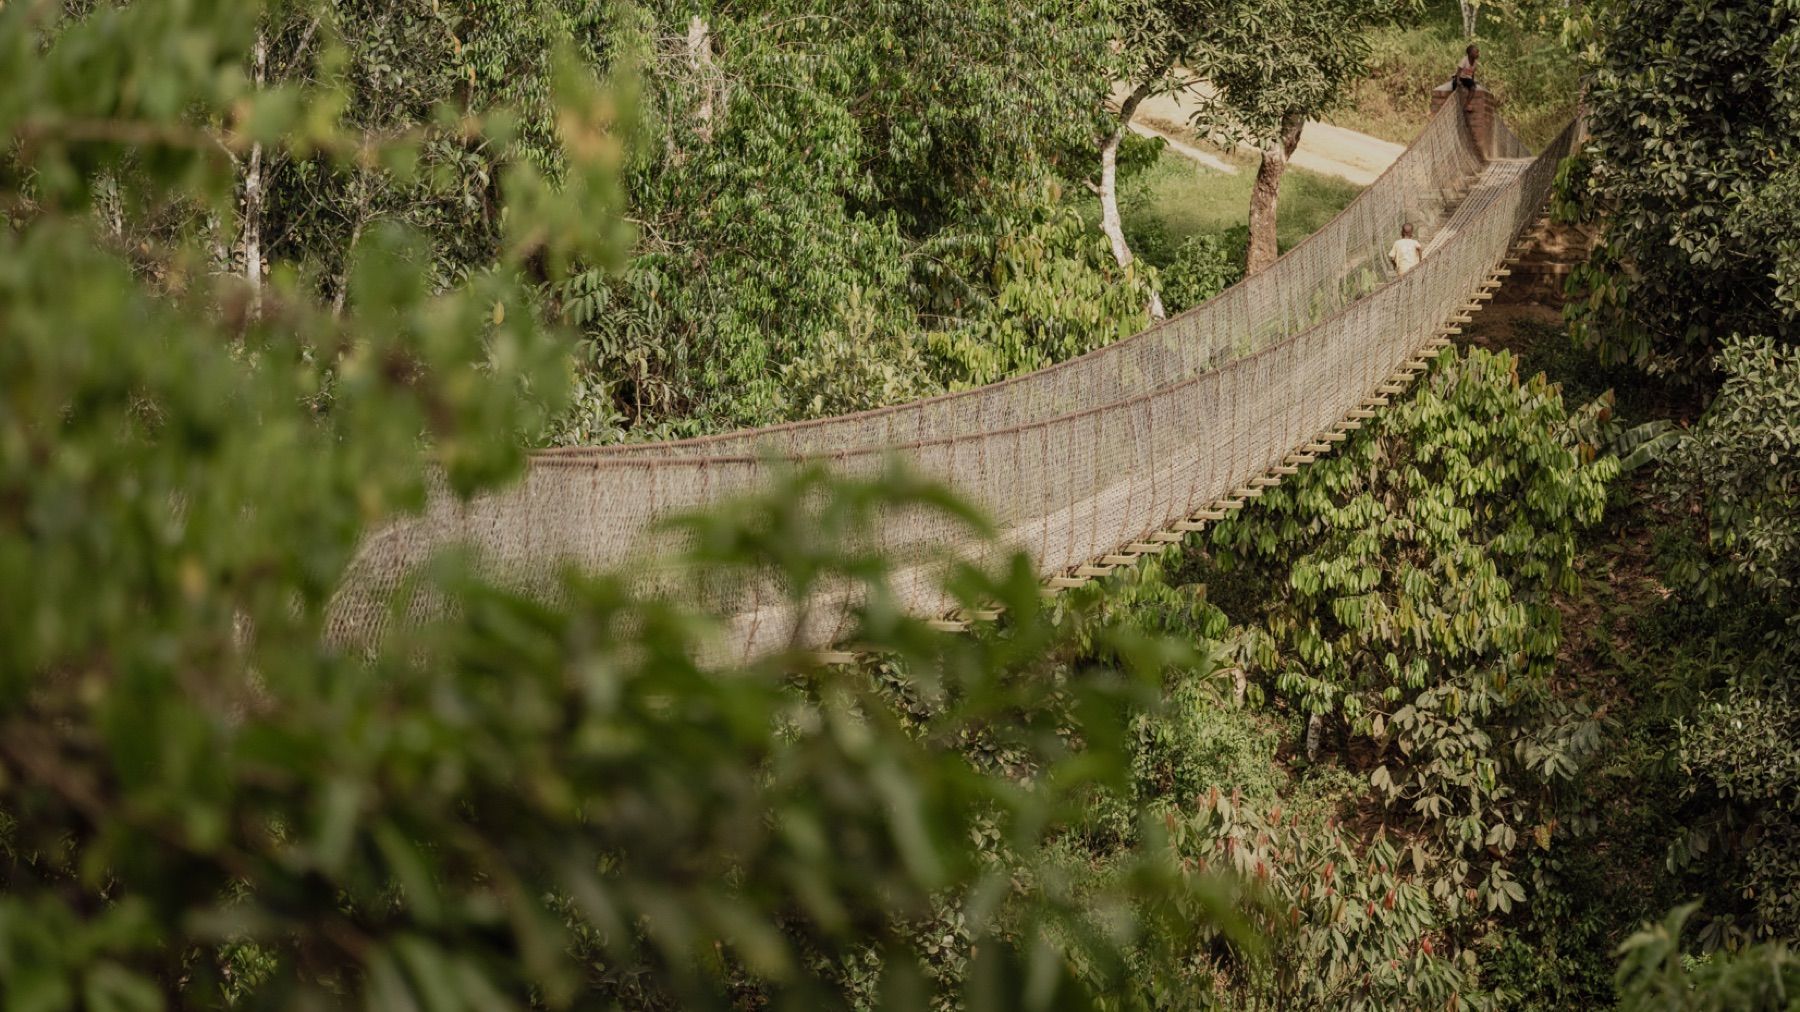
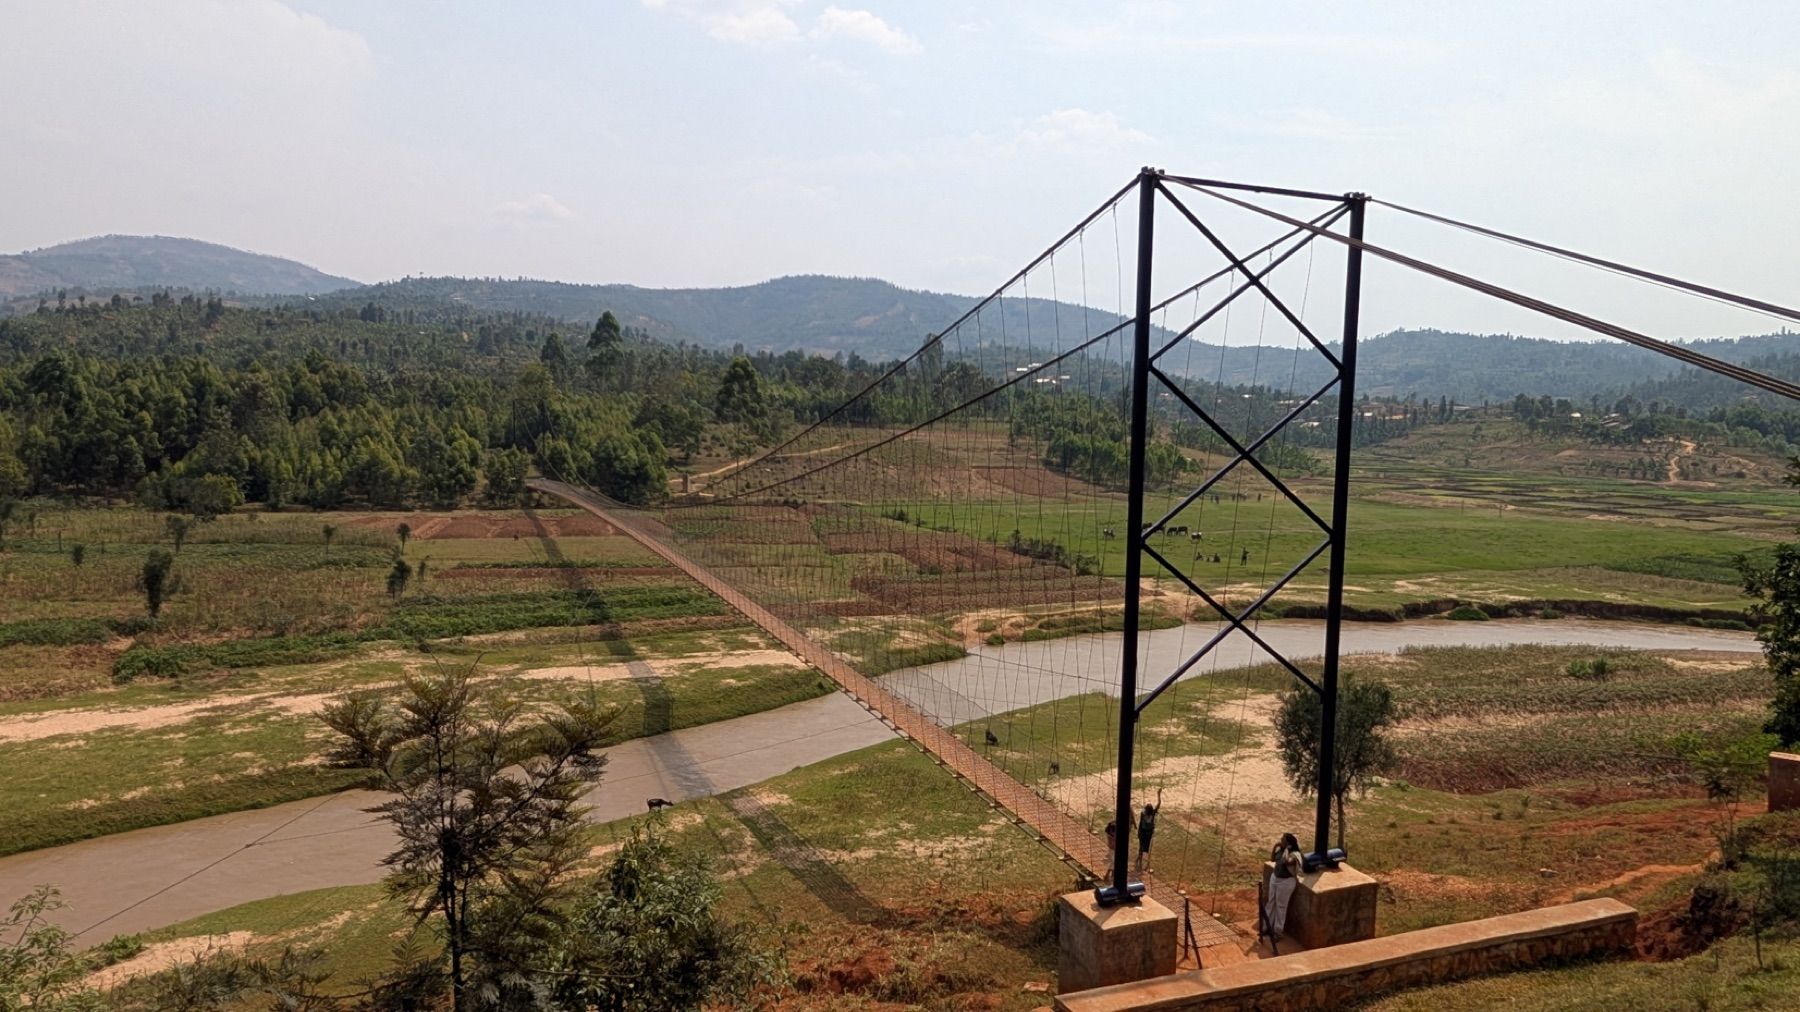
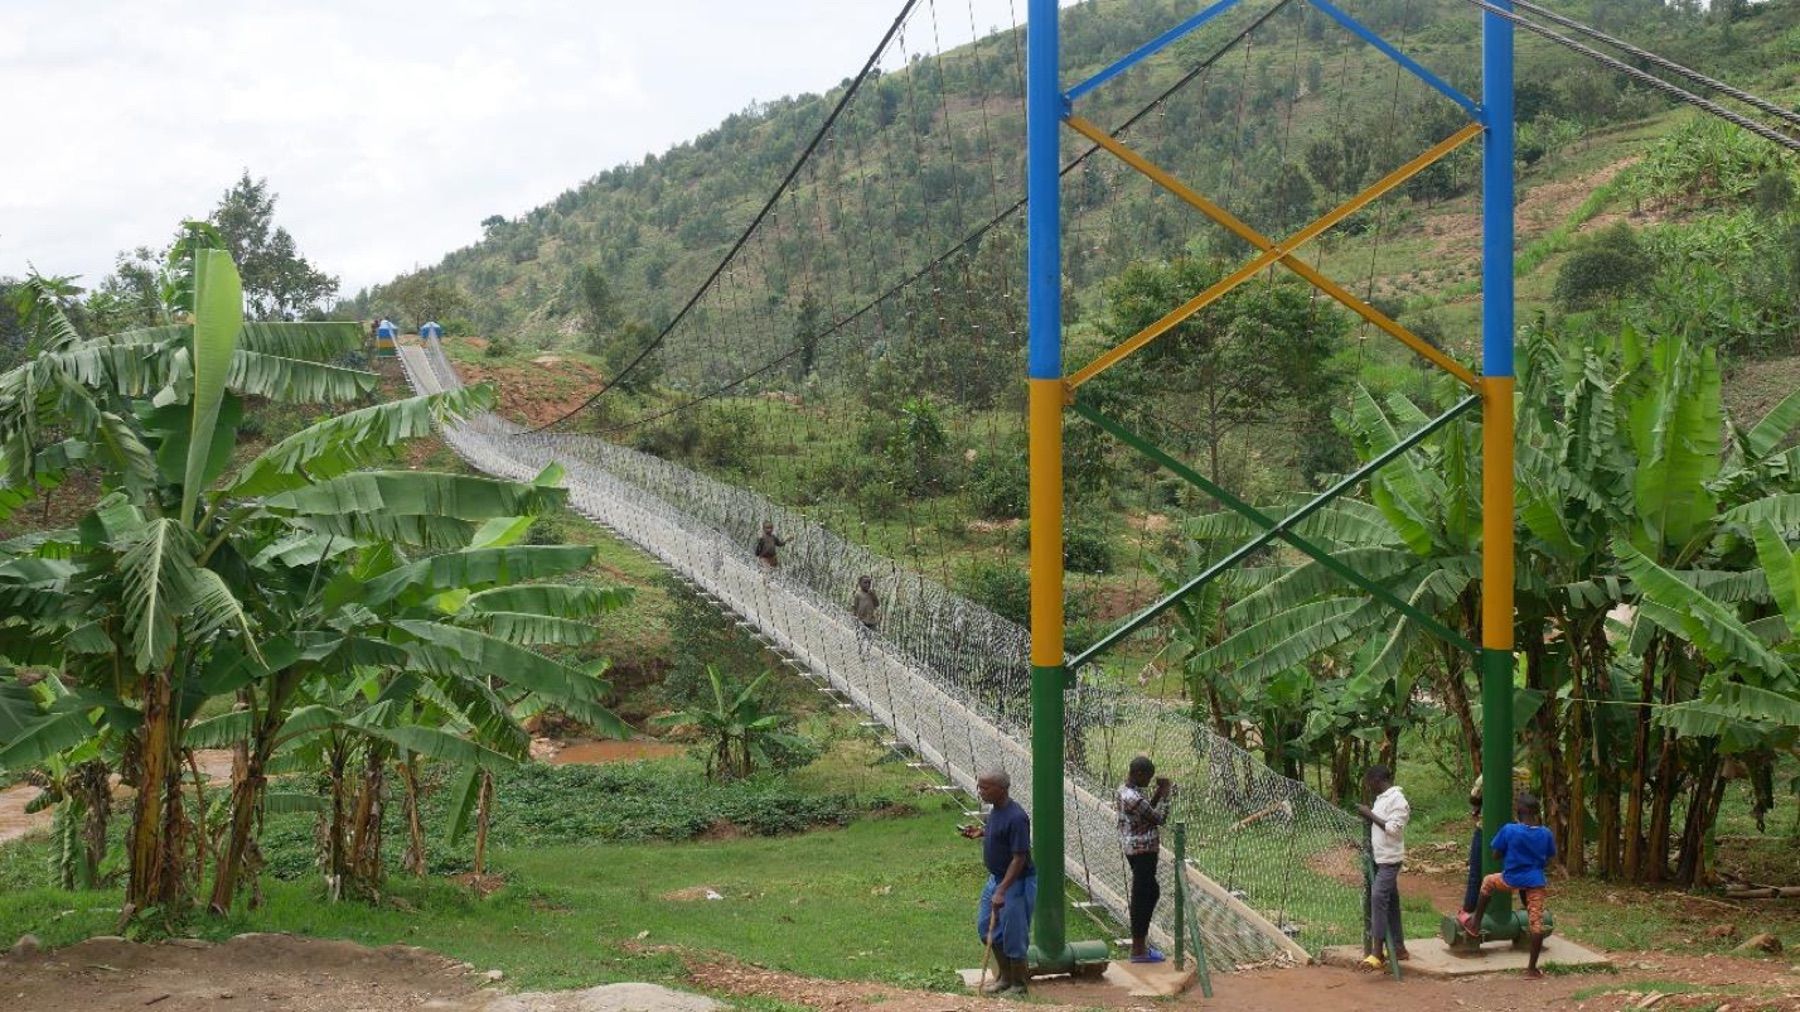
Suspended: 74 of the 97 study bridges.Suspension: 19.Hybrid suspension: 4.
Spans in the study ran from 38 to 156 m (median 75 m). Engineers check river shape, width and soil before a site is approved, and some sites cannot take any of the three.
Photos: Fika. Counts and spans: Thomas et al. (2026), manuscript in revision, Methods. Site feasibility: Brooks, Donovan et al. (2026), working paper.
1 min. Compare the photos: the suspension bridge has towers on each bank, the suspended bridge does not. Design details are in Fika’s Bridge Builder Manual. The photos are examples of each type, not necessarily study bridges.
A Bridge Site from Above
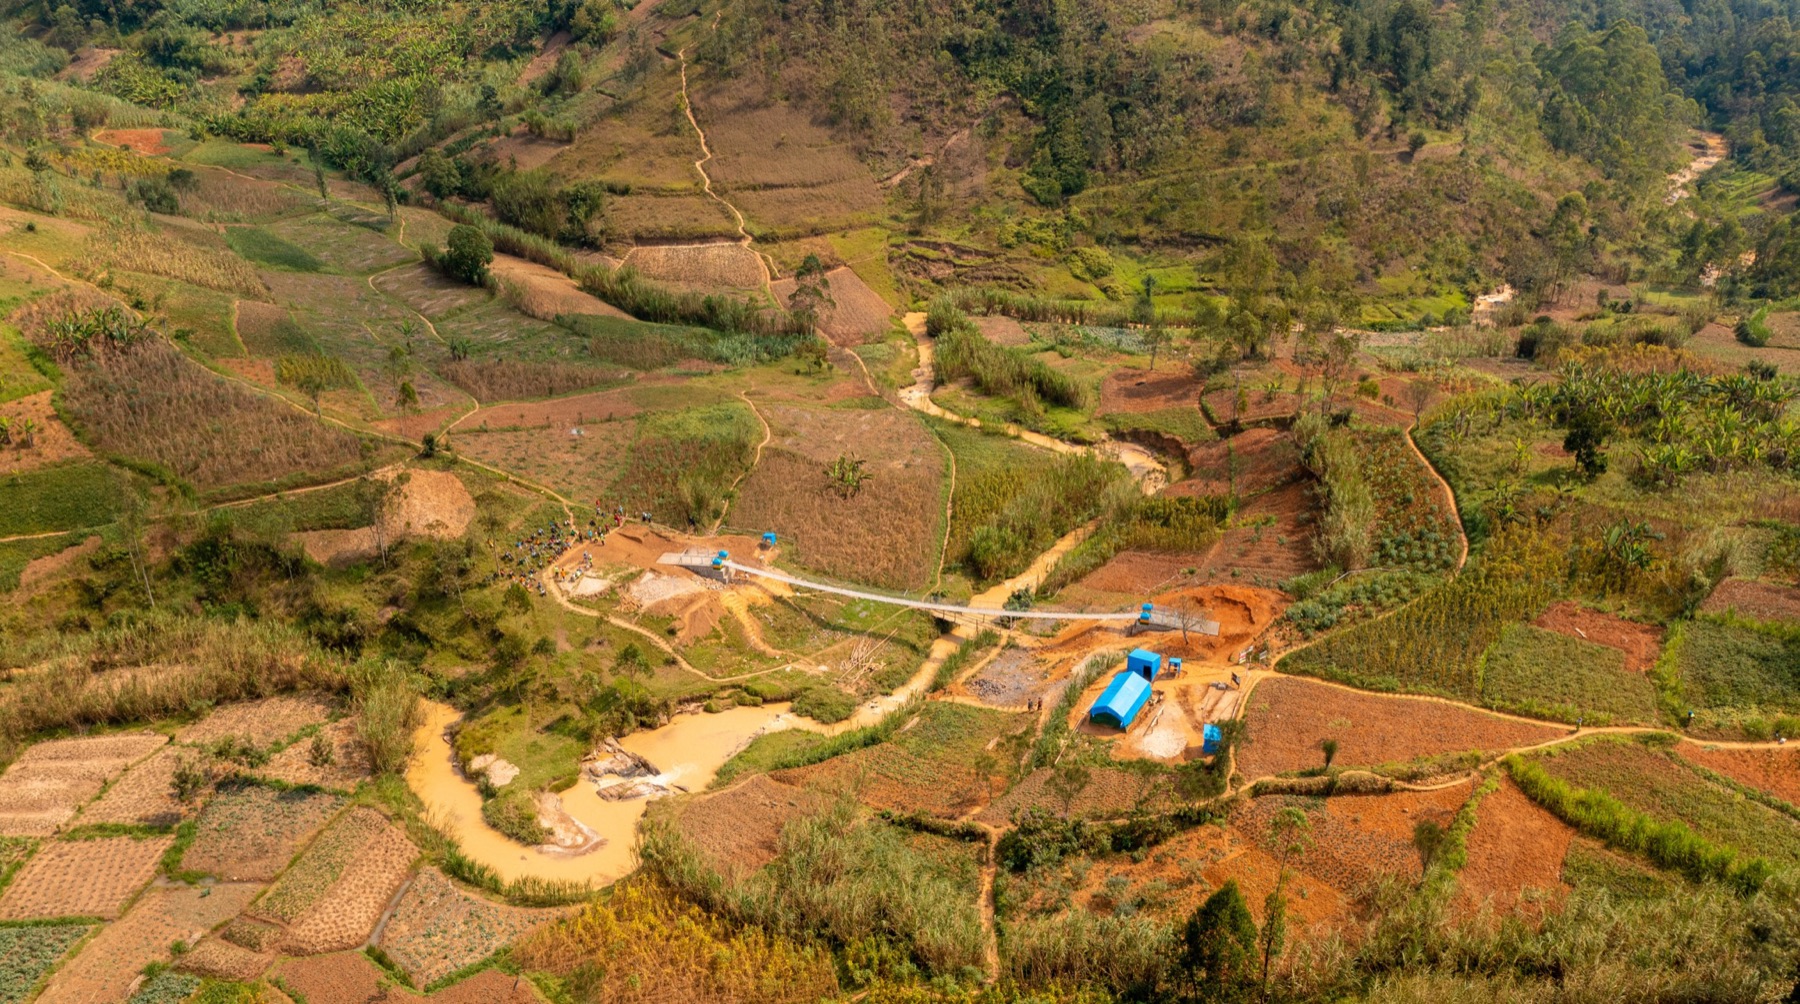
Aerial view of a study bridge under construction. Brooks, Donovan et al., working paper (2026).
Fields run down to the river on both banks. Before any bridge was built, households were already farming and renting land across it.
97%
of households farm
0.33 ha
average farm size
41%
rent land to farm
27%
cross the river to reach some of their farmland
Source: Brooks, Donovan et al. (2026), Market integration and economic development: randomized bridges in Rwanda, working paper; baseline survey 2020–21.
2 min. 0.33 hectares is less than one acre; average farms in rich countries are over 50 hectares. Renters cross more than owners: 35% of renters cross the river to reach land, against 21% of non-renters. The main staples are beans, sweet potatoes, maize and cassava; the main cash crops are bananas (about half of households grow them) and coffee (13%). Bananas mature in 12–18 months, coffee in 3–4 years, which matters for what can change within two years.
Life on the Remote Side
At each site, one bank has better access to outside markets. Before construction, households on the other bank were much more likely to have to cross the river to reach services.
The gap is about which bank you live on. Distance to the crossing made little difference: either you have to cross or you do not.
Own farmland is the exception. Households on both banks crossed to farm, so the river separates fields as well as services.
Remote side minus market side, same site (percentage points of households that must cross)
Health clinic
+38
Bank
+36
Market to buy food
+29
Government office
+26
Market to sell crops
+11
Own farmland
0
Source: Brooks, Donovan et al. (2026), working paper, baseline table of access by side of river (site fixed effects, about 9,800 households). All differences except own farmland significant at p < 0.01.
2 min. The regression compares households on opposite banks of the same river, controlling for distance to the bridge site. Selling crops shows a smaller gap partly because households that do not sell are counted as zero. The farmland result is the one to remember: crossing happens in both directions, which is why land markets will matter later.
Photo: Robb Hohmann / Fika, Gahira bridge, Rwanda
Part 3
How Do You Evaluate a Bridge?
A randomized rollout, 2020–2024
Think, pair, share · 3 minutes
Design the Evaluation
The government and the builder have chosen 97 sites and will build all of them over four years. You want to know what a bridge does to household well-being. What goes wrong with each design?
Survey the same households before and after their bridge is built.Weather, prices and COVID-19 change too
Compare villages that got a bridge with villages that never did.Sites without bridges differ
Let the builder choose the order, then compare early sites with late ones.Builders go first where they expect most gain
Randomize the order of construction.What the study did
3 min. Governments place infrastructure where they expect growth, which makes most infrastructure evaluations hard to trust. The pre-analysis plan listed 50 “long-term control” sites, but they had been set aside because engineers found a bridge there infeasible, so they differ from the built sites and the paper does not use them as controls. Randomizing order is fair to communities: no one is denied a bridge, only asked to wait a turn they would have waited anyway.
A Randomized Rollout
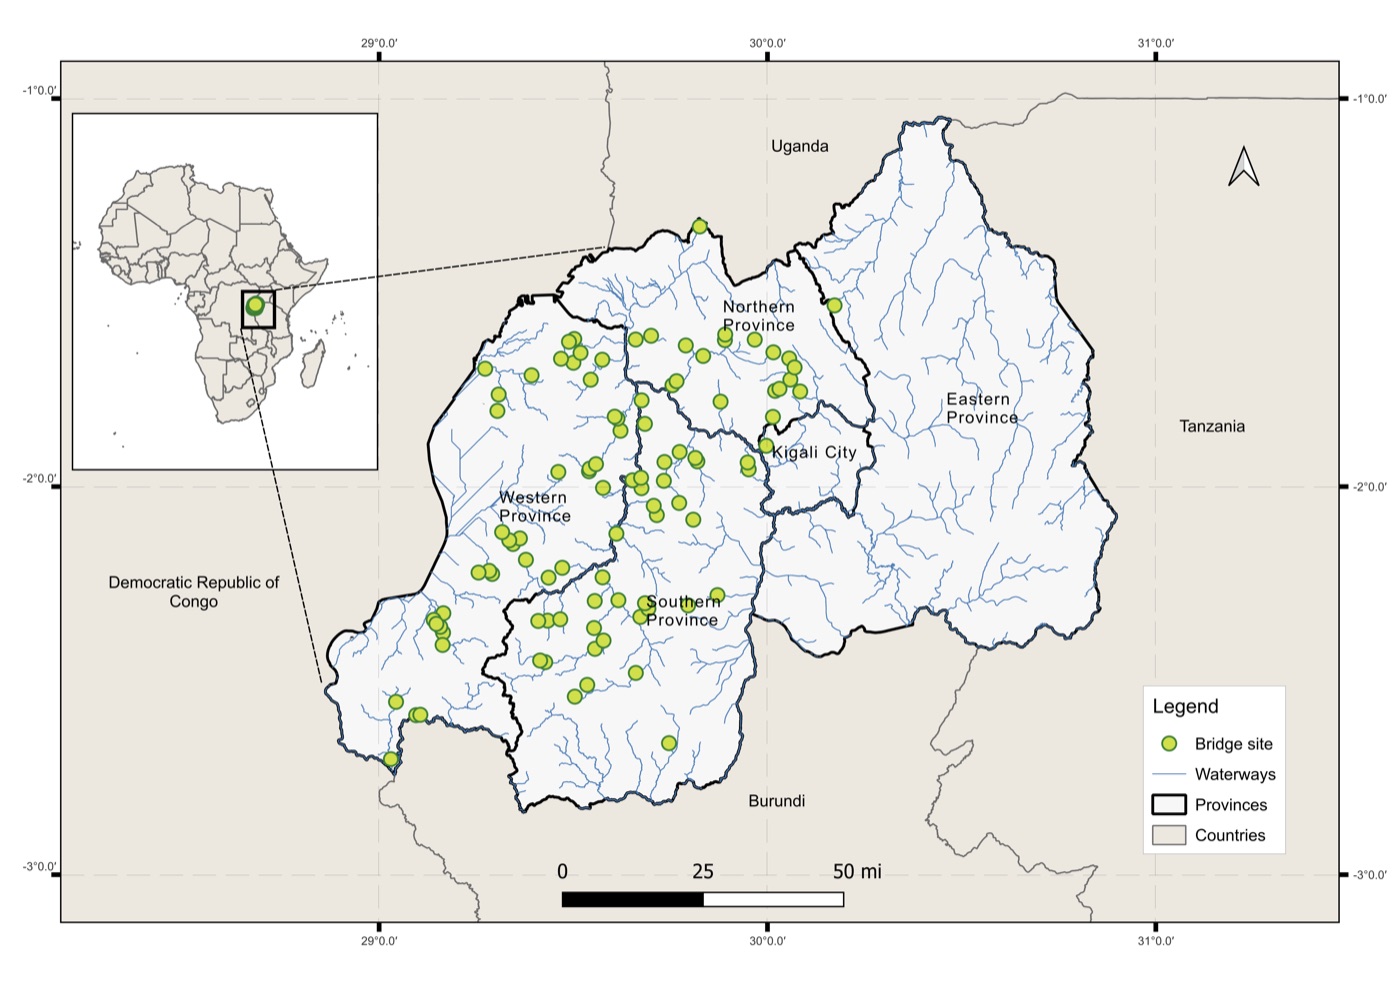
Fika chose the sites. The researchers randomized the order in which they were built, within each of 18 districts. Every site got its bridge, so the comparison is between villages that got theirs earlier and those still waiting.
The 97 study bridge sites.
10,167
Households in 290 villages
39,059
Household surveys, 4 yearly rounds
Source: Thomas et al. (2026), manuscript in revision. Pre-analysis plan: Macharia et al. (2022). AEA RCT Registry AEARCTR-0013478.
3 min. This design is a stepped-wedge cluster randomized trial. It answers the usual objection to randomizing infrastructure: no community is denied a bridge, only made to wait its turn, which it would have done anyway. 90% of households were interviewed in all four rounds. COVID-19 slowed the first year of construction, so cohort sizes differ from the plan (17, 35, 45). Ask: why randomize the order instead of comparing bridge villages with villages that never got one?
Who Was Surveyed
Schematic of one site; layouts vary. At each site, one bank has better access to markets and services, and surveyed villages can lie on either bank.
Cell leaders on both banks named the three villages most affected: those for which this crossing was the only route to a school, clinic, weekly market, employer or road.
35 households per village, drawn at random from village records.
The same households every year: 90% answered all four rounds, 96% at least three.
Food consumption, purchased and home-grown (past week)
Harvest and sales of each crop, input spending, livestock
Wages, transfers and other income
Food security, school enrollment, children’s arm circumference, missed medical care
Sources: Thomas et al. (2026), manuscript in revision, Methods; Macharia et al. (2022), Science of the Total Environment 838:156546 (pre-analysis plan).
2 min. The village choice matters for the rate of return later: these are the villages most affected, so applying their effect to everyone within 3 km is an assumption. Mid-upper arm circumference (MUAC) is a quick field measure of child undernutrition.
Reading the Comparison
Year 1 and year 2
The year-1 effect is measured in the first survey after a site’s bridge opened, the year-2 effect in the second. Bridges opened at different times in the year before a survey, so some year-1 sites had a bridge for only a few months.
Why year 2 rests on 56 sites
Every site had a bridge by the last survey, so no comparison group is left after that. The year-2 effect compares the 22 sites built first with the 34 built last, at the second follow-up.
Pre-registered method
The estimator (Roth and Sant’Anna, for staggered rollouts) and the primary outcomes were set in a published pre-analysis plan before the results were known. Outcomes are averaged to the site level.
Spillovers
If people at a waiting site used a neighboring site’s new bridge, effects would be understated. The median distance between study bridges is 3.5 km; in the year-2 round, 4 of the 34 waiting sites were within 3 km of a finished bridge.
Source: Thomas et al. (2026), manuscript in revision, Methods; Roth & Sant’Anna (2023), J. Political Economy Microeconomics 1:669.
2 min. Pre-registration answers a fair student question: with 16 outcomes, would you not find something by chance? The plan fixed the primary outcomes in advance; three outcomes added later (food security index, life and financial satisfaction) are marked with open markers on the next figure.
Predict first · 3 minutes · individually
Two Years After a Bridge, What Changed?
For each outcome, write up, down or no clear change.
Household consumptionUp 8.7%
Household incomeNo clear change
Number of cash crops grownUp 13.5%
Fertilizer spendingNo clear change
Food securityUp 0.24 SD
School enrollment, ages 13–18Up 4.4 points
School enrollment, ages 6–12No clear change
Arm circumference, children under 5No clear change
3 min. Collect a show of hands on income before revealing. Most students predict income rises; it did not change significantly, and the next slides explain why consumption is the better measure here. “No clear change” means the 95% confidence interval includes zero, not that the effect is known to be zero.
Photo: Robb Hohmann / Fika, Gahira bridge, Rwanda
Part 4
What Changed
Household outcomes, and how the gains happened
What Changed Two Years After a Bridge
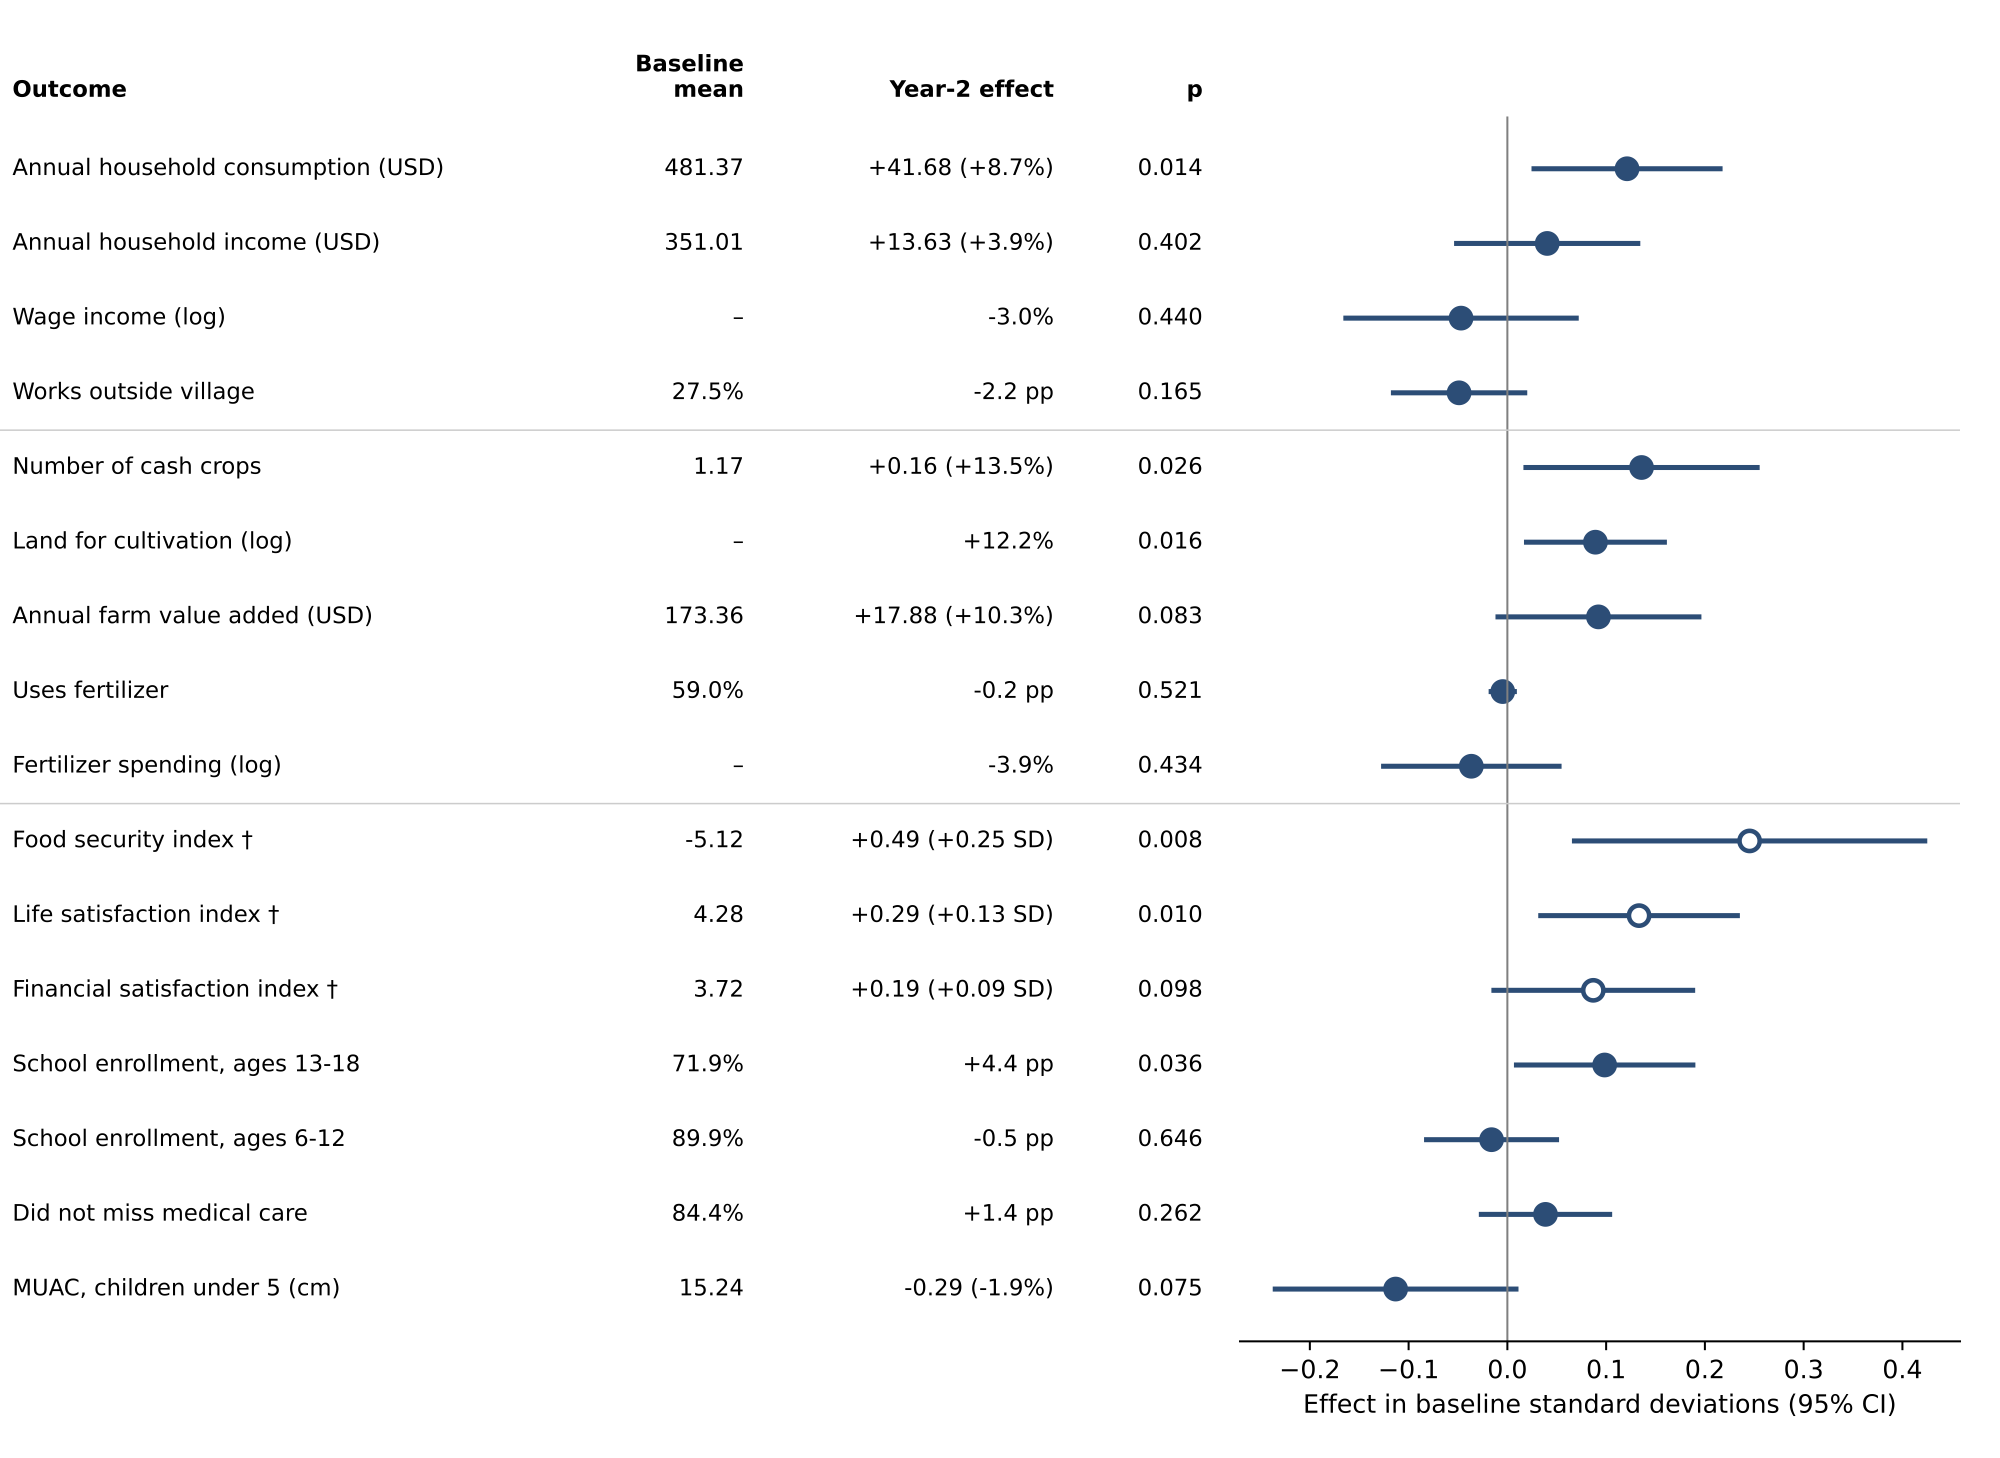
Year-2 effects on 16 household outcomes, with 95% confidence intervals. Open markers: outcomes not in the pre-analysis plan.
+8.7%
Household consumption ($41.68 a year)
+13.5%
Number of cash crops grown
+4.4 pp
Secondary school enrollment, ages 13–18
Land under cultivation rose 12.2% and food security improved. Income, wages and working outside the village did not change significantly.
The gains came through farming: households could reach fields and markets across the river and grew more crops to sell.
Source: Thomas et al. (2026), manuscript in revision, Figure 2.
3 min. Farm value added rose 10.3% but with p = 0.083. The rise in consumption was in market purchases, not food eaten from the household’s own farm. Consumption is the preferred welfare measure here because income in farming households is seasonal and partly in kind. A companion paper (Brooks et al.) shows households cultivating and renting more land across the river. Note for presenter: the manuscript text gives the food security effect as 0.24 SD and the figure as 0.25 SD.
Consumption Rose; Income Was Unclear
+$41.68
Consumption a year (+8.7%, p = 0.014)
+$13.63
Income a year (+3.9%, p = 0.40)
The rise in consumption came from market purchases. Food eaten from the household’s own farm did not change significantly.
Averaged over years 1 and 2, the consumption effect is $18.40 (p = 0.091), because many year-1 sites had a bridge for only part of the year.
Why economists trust consumption here
Farm income arrives at harvest, so a weekly or monthly recall misses most of it.
Much of it is paid in kind: crops eaten, bartered or stored.
Households smooth spending across the year, so consumption tracks long-run income more steadily.
In this study the consumption estimate is also the more precise of the two.
Sources: Thomas et al. (2026), manuscript in revision; Deaton (1997), The Analysis of Household Surveys.
3 min. Dollar values are 2019 USD. A p-value of 0.40 means an effect this size would be common by chance, so the income result is uninformative, not proof of no effect. Ask: if you were the Ministry, which number would you put in a press release, and which would you defend to an auditor?
How the Gains Happened: Land
In the trial paper
Land under cultivation rose 12.2% (p = 0.016).
Farm value added rose 10.3% (p = 0.083), all of it from larger harvests.
No significant change in fertilizer or other inputs.
Wages and work outside the village did not change significantly.
Households grew more on more land. They did not farm more intensively on the land they already had.
In the companion paper (preliminary)
After a bridge, households were more likely to rent land and to farm across the river.
Larger farms expanded by renting land on the other bank. Local farm wages rose, and smaller farmers shifted from non-farm work toward farm work nearby.
Crop prices did not change, and households on the remote and market sides gained about equally.
The bridge mainly connected land and labor across the river. Easier trips to market played a smaller part.
Sources: Thomas et al. (2026), manuscript in revision; Brooks, Donovan et al. (2026), working paper.
3 min. In the companion paper everyone gains, but larger farms gain more, so the gains are tilted toward better-off households. Point back to the aerial photo: fields on both banks, and 27% already crossing to farm at baseline. The companion work is still in progress; present its findings as the authors’ current reading, not settled results.
Where Bridges Helped Most
Sites differ in how many people share the land around them.
Denser sites are closer to towns. Before construction, households there earned more from non-farm work, farmed smaller plots and sold less outside the village.
With one standard deviation more people within 2.5 km (baseline)
Outcome
Difference
Non-farm wage earnings
+34.6%
Farm wage earnings
−19.0%
Farm size
−11.6%
Selling outside the village
−14.6%
Effects of the bridge (preliminary)
The gains were concentrated where land is plentiful relative to the number of workers. In the quarter of sites with the least land per worker, the effects were close to zero.
In this setting a bridge paid off mainly by giving farmers access to more land. Where there is no spare land across the river, there is less to gain.
Source: Brooks, Donovan et al. (2026), working paper. Population from WorldPop, within 2,500 m of each site.
2 min. This connects to an old idea in agricultural economics, Ester Boserup (1965): how much land each worker has shapes how a farming economy works. Keep this result in mind for the rate-of-return calculation, which assumes every household gains the same amount.
Photo: Fika
Part 5
Is It Worth It?
The economic rate of return, and where to build next
Is a $100,000 Footbridge Worth It?
Treat each bridge as an investment: $100,000 up front, then each beneficiary household gains $8.12 in year 1 and $41.68 a year after that, for a 40-year design life. Solve for the rate of return r:
100,000 / N = 8.12/(1+r) + Σt=2..40 41.68/(1+r)t
N is the number of households that benefit. WorldPop puts about 16,400 people within 3 km of the average study bridge, or 3,556 households.
Foreign aid projects average about a 20% economic rate of return. A similar bridge study in Nicaragua, at sites with much lower population density, found 19%.
Rate of return by number of beneficiary households
3,556 (within 3 km)
91.3%
2,000
58.6%
1,000
33.3%
691 (Fika’s count of people with no other crossing)
24.3%
555
20%
Every one of the 97 sites has more than 555 households within 3 km. Across sites the return ranges from 47% to 120%; the median site is 79.5%.
Sources: Thomas et al. (2026), manuscript in revision, and Supplementary Tables 2–3; Dalgaard & Hansen (2017) for the aid benchmark; Brooks & Donovan (2020), Econometrica, for Nicaragua.
3 min. Callback to the LCA "functional unit": the answer depends almost entirely on N, how many households a fixed asset serves. Robustness: using the lower end of the 95% confidence interval for the consumption effect ($8.40) gives 29.7%. Maintenance at 2% or 5% of cost a year gives 89.8% and 87.5%. If the effect halves every ten years, 87.0%. A 20- or 30-year life gives the same answer, because at these rates distant years count for little. Students can solve the equation in a spreadsheet with Goal Seek.
What Moves the Answer
Change one assumption (3,556 households)
Assumption
Rate of return
Central case
91.3%
Bridge life 20 or 30 years, not 40
91.3%
Maintenance 2% of cost a year
89.8%
Maintenance 5% of cost a year
87.5%
Effect halves every 10 years
87.0%
Effect at lower end of 95% CI ($8.40)
29.7%
Same effect, applied at each of the 97 sites
Site
Rate of return
Fewest households (1,535)
47.4%
10th percentile
59.6%
25th percentile
67.8%
Median (2,966 households)
79.5%
75th percentile
103.3%
90th percentile
119.8%
At returns this high, years beyond the first two decades barely count. The effect size and the number of households served decide the answer.
Source: Thomas et al. (2026), manuscript in revision, Supplementary Tables 2–3.
2 min. Ask why bridge life barely matters: a dollar 25 years out, discounted at 90% a year, is worth almost nothing today. The one assumption that moves the answer a lot is the effect size; even the low end of the confidence interval gives 29.7%, still above the 20% aid benchmark.
The Placement Puzzle
The rate of return assumes every household gains the same amount. The companion paper suggests they do not.
More households, more benefit
A bridge costs the same whether it serves 1,000 households or 5,000, so for a fixed effect per household, denser sites return more.
More households, smaller effect
The effect per household was smaller where land is scarce, and denser sites have less land per worker.
Which force wins? Within the study’s range of sites, the effect fell faster than the population rose, so total benefit was highest at the least dense sites studied.
Below that range the answer must turn around, since a bridge with no one nearby benefits no one. On that assumption, the authors find that the best site would serve fewer than 1,000 households, below the range the trial observed.
The usual rule, “build where the most people live,” may not hold when gains per household fall with density.
Source: Brooks, Donovan et al. (2026), working paper, section on maximizing the rate of return when density matters (preliminary).
2 min. This is a corner solution: the data push the best site toward the edge of the sample, so the optimum itself is an extrapolation. The authors plan to use their economic model to extrapolate below 1,000 households; treat this slide as a question the field is working on.
Finding Where Bridges Are Needed
How the 97 study sites were chosen
Fika and the government ran a nationwide needs assessment, weighing local population, distance to services, how hard the crossing is and whether alternatives exist. Engineers then rejected sites where river shape, width or soil ruled out a bridge.
Doing it remotely, for whole countries
1. Map the waterwaysWaterNet
2. Find where routes to schools, clinics and markets cross themfrom publicly available data
3. Estimate cost and impactFika Map tool suite, in development
4. Confirm on the groundcommunity requests, engineering survey
Share of 4,790 community bridge requests in six countries that lie on a mapped waterway
OpenStreetMap
36%
TDX-Hydro
62%
WaterNet
93%
Country ranges: OpenStreetMap 5–72%, TDX-Hydro 37–85%, WaterNet 88–96%. Rwanda’s requests came from its nationwide assessment.
A river on a map shows where a bridge could go. The trial shows that what it delivers depends on who lives nearby and what land lies across the water.
Sources: Brooks, Donovan et al. (2026), working paper (site selection); Pierson & Mehrabi (2024), Deep learning waterways for rural infrastructure development, arXiv:2411.13590; Kruse (2024), Fika blog.
3 min. The six countries are Rwanda, Uganda, Ethiopia, Liberia, Côte d’Ivoire and Zambia; requests were collected differently in each (nationwide in Rwanda, regional in Uganda and Ethiopia, opportunistic in others). The test measures recall: does the map show a river where communities asked for a bridge? A map that drew rivers everywhere would score 100%, so recall alone does not prove accuracy; the authors check false positives against US data. “Fika” means “arrive” in Swahili. Link to the next activity: steps 1–3 can rank candidate sites cheaply, but the trial evidence on land and density is what tells you which ones will pay off.
Activity · 8 minutes · groups of three
You Can Fund One Bridge
Each costs $100,000. These sites are invented for the exercise.
Site
Households within 3 km
Nearest town
Land across the river
Rate of return at the study’s average effect
A
800
25 km
Plenty, partly unfarmed
27.5%
B
5,000
3 km
Small plots, all farmed
117.7%
C
1,500
12 km
Some for rent
46.5%
Solve for the rate of return at each site, using $8.12 in year 1 and $41.68 a year after that for 40 years.
Now use what the trial and the companion paper found about land. Does your ranking change?
What one thing would you measure at each site before deciding?
8 min. 4 min to compute (spreadsheet with Goal Seek on the rate, or NPV at trial rates), 4 min to discuss. At the average effect, B wins by a wide margin. But B looks like the dense, land-scarce sites where the companion paper found effects near zero, so its true return could be far lower. A is below the study’s range of densities, so the trial says least about it. Good answers to question 3: how many people cross now, how many days a year the river is impassable, how much land across the river is farmable, and how far the nearest other crossing is.
Nicaragua and Rwanda: Same Tool, Different Mechanism
Nicaragua (Brooks & Donovan 2020)
Rwanda (this study)
Scale and design
6 bridges at 15 sites, not randomized
97 bridges, construction order randomized
Cost per bridge
About $40,000
About $100,000
Problem solved
Seasonal floods; rivers crossable in the dry season
Rivers hard or impossible to cross year-round
What the bridge connected
Villages to local towns, low population density
Villages to each other, dense farming hills
Main channel of gains
Off-farm jobs in town
Farming, land and farm labor
Economic rate of return
19%
91.3% (central case)
In both countries a footbridge paid back about as well as or better than the average aid project. The way households used it depended on what lay across the river.
Sources: Brooks & Donovan (2020), Econometrica 88:1965; Thomas et al. (2026), manuscript in revision; Brooks, Donovan et al. (2026), working paper.
2 min. The Nicaragua bridges were technically simpler and cheaper. The lower return there comes mostly from serving far fewer people per bridge. Ask: if you were designing a third study, in what kind of place would you put it?
What the Study Cannot Tell Us
The long run. Effects were measured for two years. The rate of return assumes the year-2 effect lasts for the life of the bridge.
A small year-2 comparison. The year-2 effect rests on 22 early sites against 34 late ones.
Floods. The study did not count days when crossings were impassable, so it cannot say whether bridges helped more in wetter places.
Everyone within 3 km. Surveyed villages were those most affected. Applying their gains to all households within 3 km is an assumption.
Other kinds of bridges. These carry people, livestock and motorcycles. The results are not estimates for bridges that carry vehicles.
What made some sites work. Sites differ in roads, services, institutions and how much the community took part in building. Participation was not measured.
2 min. Each limit is a research question. Bridge crossings counted by motion-activated cameras at eight study bridges, and their link to rainfall and streamflow, are in Macharia et al. (2023).
Discussion · 6 minutes · pairs, then share
Should Rwanda Build the Next Hundred?
Consumption rose but income did not change significantly. What explanations fit both results?
Larger farms gained more than smaller ones. Does that change whether you would build, or how?
The rate of return rises with the number of people nearby. Which communities does a rule based on it leave out, and should it?
District governments maintain the bridges after handover. What would you track to know they will still work in 20 years?
Satellite maps now show where rivers cut people off. What would they miss that a visit to the community would catch?
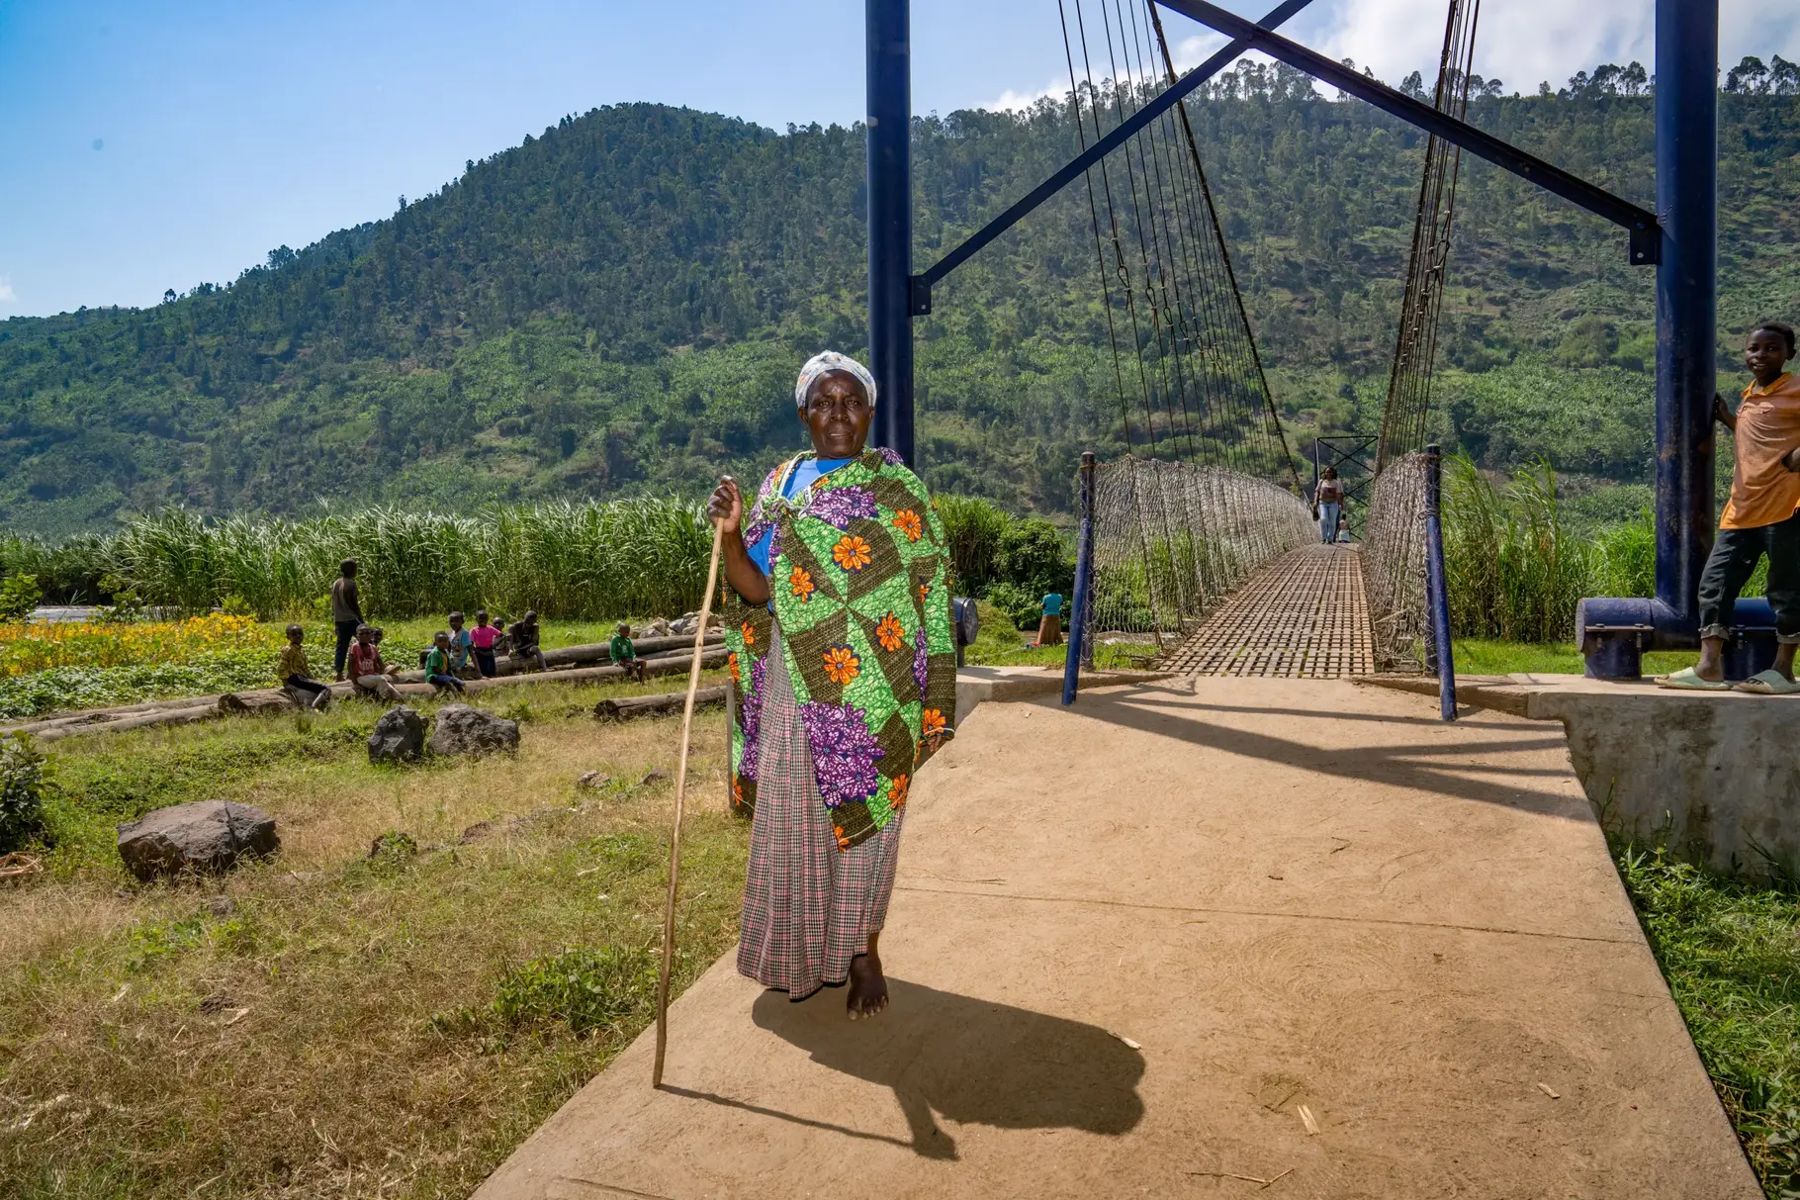
Naomi Nibishaka crosses a newly built Fika bridge. Photo: Fika.
6 min. For question 1, the paper’s reading is that gains came through farming and showed up as market purchases; farm income is harder to measure than spending. For question 3, Nicaragua’s low-density sites returned 19%, close to the aid benchmark, and every Rwandan study site exceeded the 555 households needed for 20%. For question 4, the study did not measure maintenance; this is open. For question 5: whether people already cross elsewhere, how many days a year the river floods, who owns land on the far bank, and whether the community wants the bridge and will help build it.
Key Takeaways
Randomizing the order of construction gave a credible estimate without denying any community its bridge.
Two years after a bridge, household consumption was 8.7% higher, with more cash crops, more land farmed, better food security and higher secondary school enrollment.
The gains came through farming: land and labor moved across the river.
The central rate of return is 91.3%, and every study site clears the 20% aid benchmark. The answer depends mostly on how many households a bridge serves and how much each gains.
Gains were largest where land is plentiful (preliminary), so the number of people nearby is not the only thing that decides where a bridge pays off.
New satellite maps reveal rivers that older maps missed, which makes finding sites cheaper. Deciding which sites pay off still needs evidence like this trial.
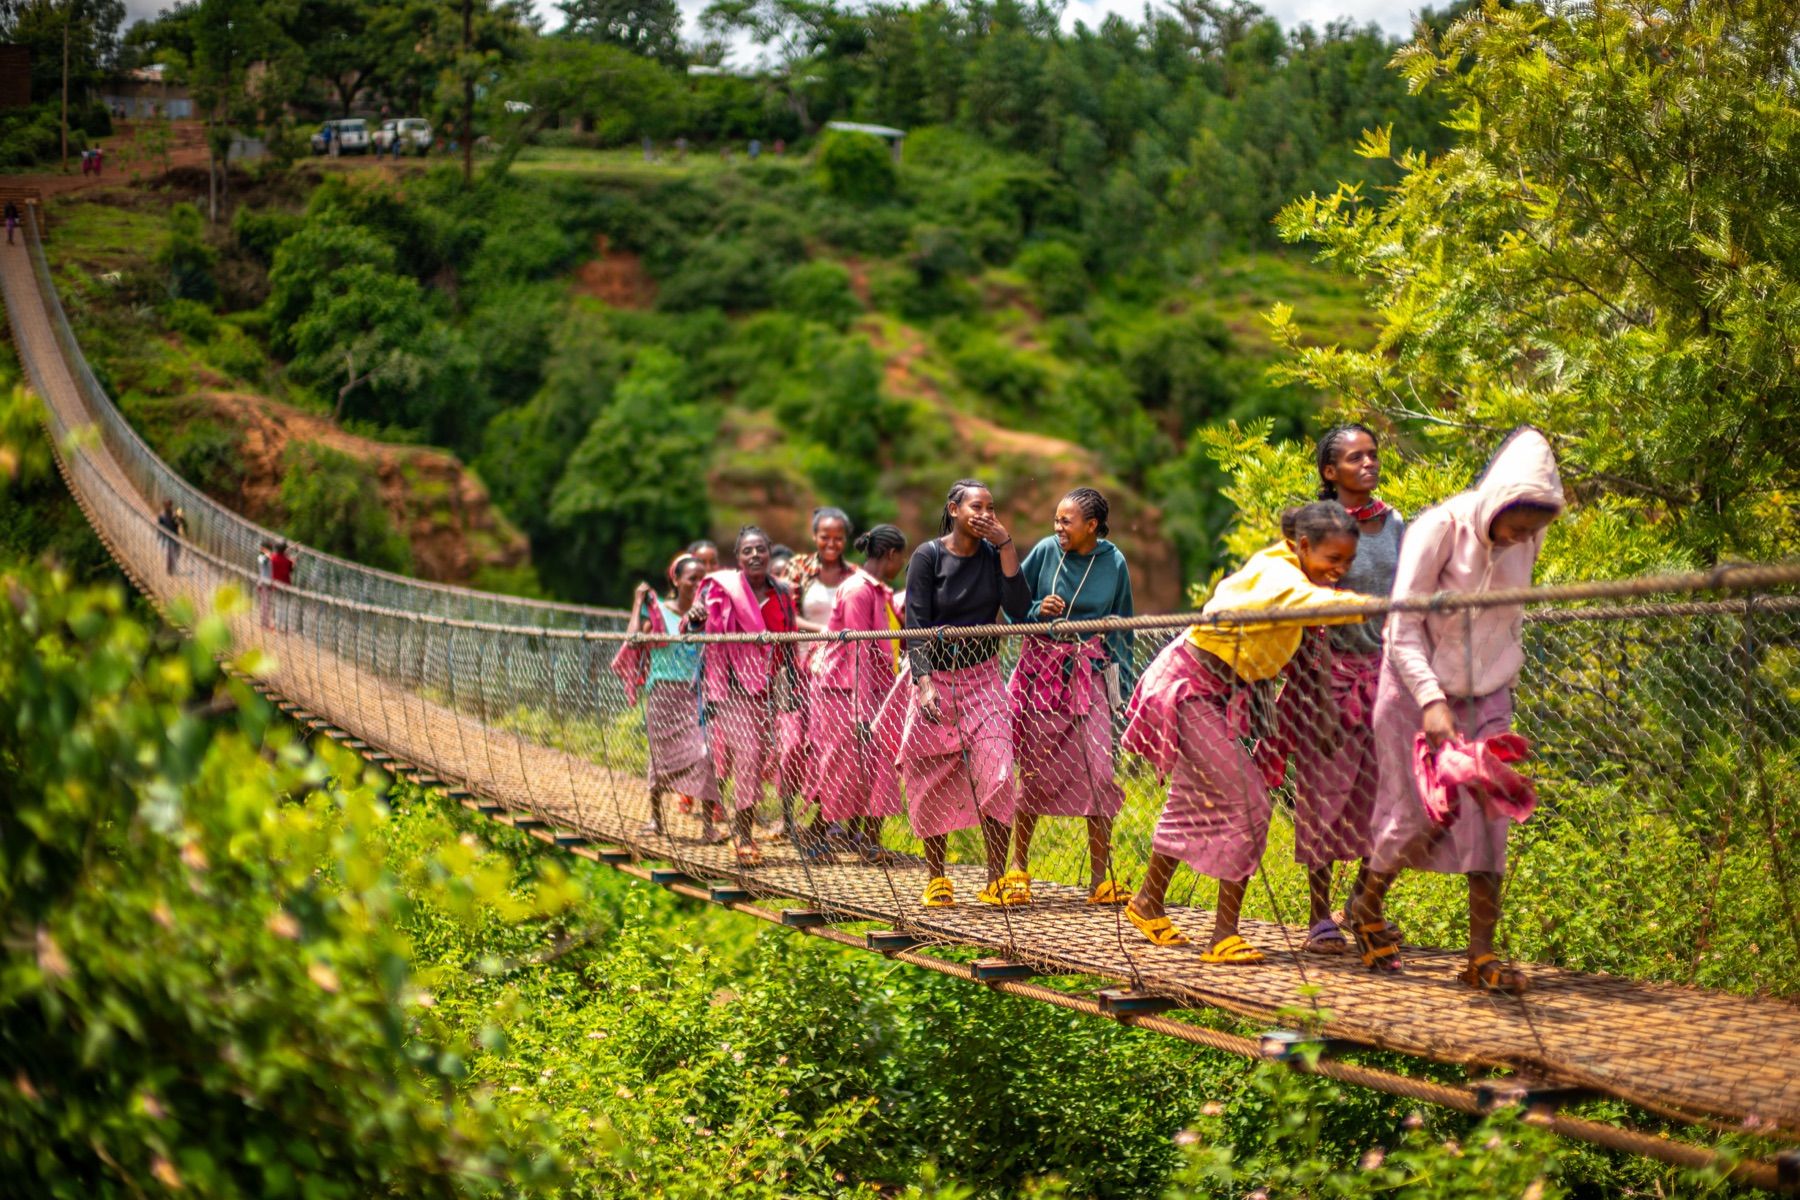
Students crossing a Fika bridge. Photo: Fika.
1 min.
Further Reading
Thomas, E., Brooks, W., Donovan, K., Muthike, D. M., Mugabo, L. & MacDonald, L. (2026). Bridge building: first-mile transportation infrastructure yields disproportionate gains for isolated communities in Rwanda. Manuscript in revision.
Brooks, W., Donovan, K. et al. (2026). Market integration and economic development: randomized bridges in Rwanda. Working paper.