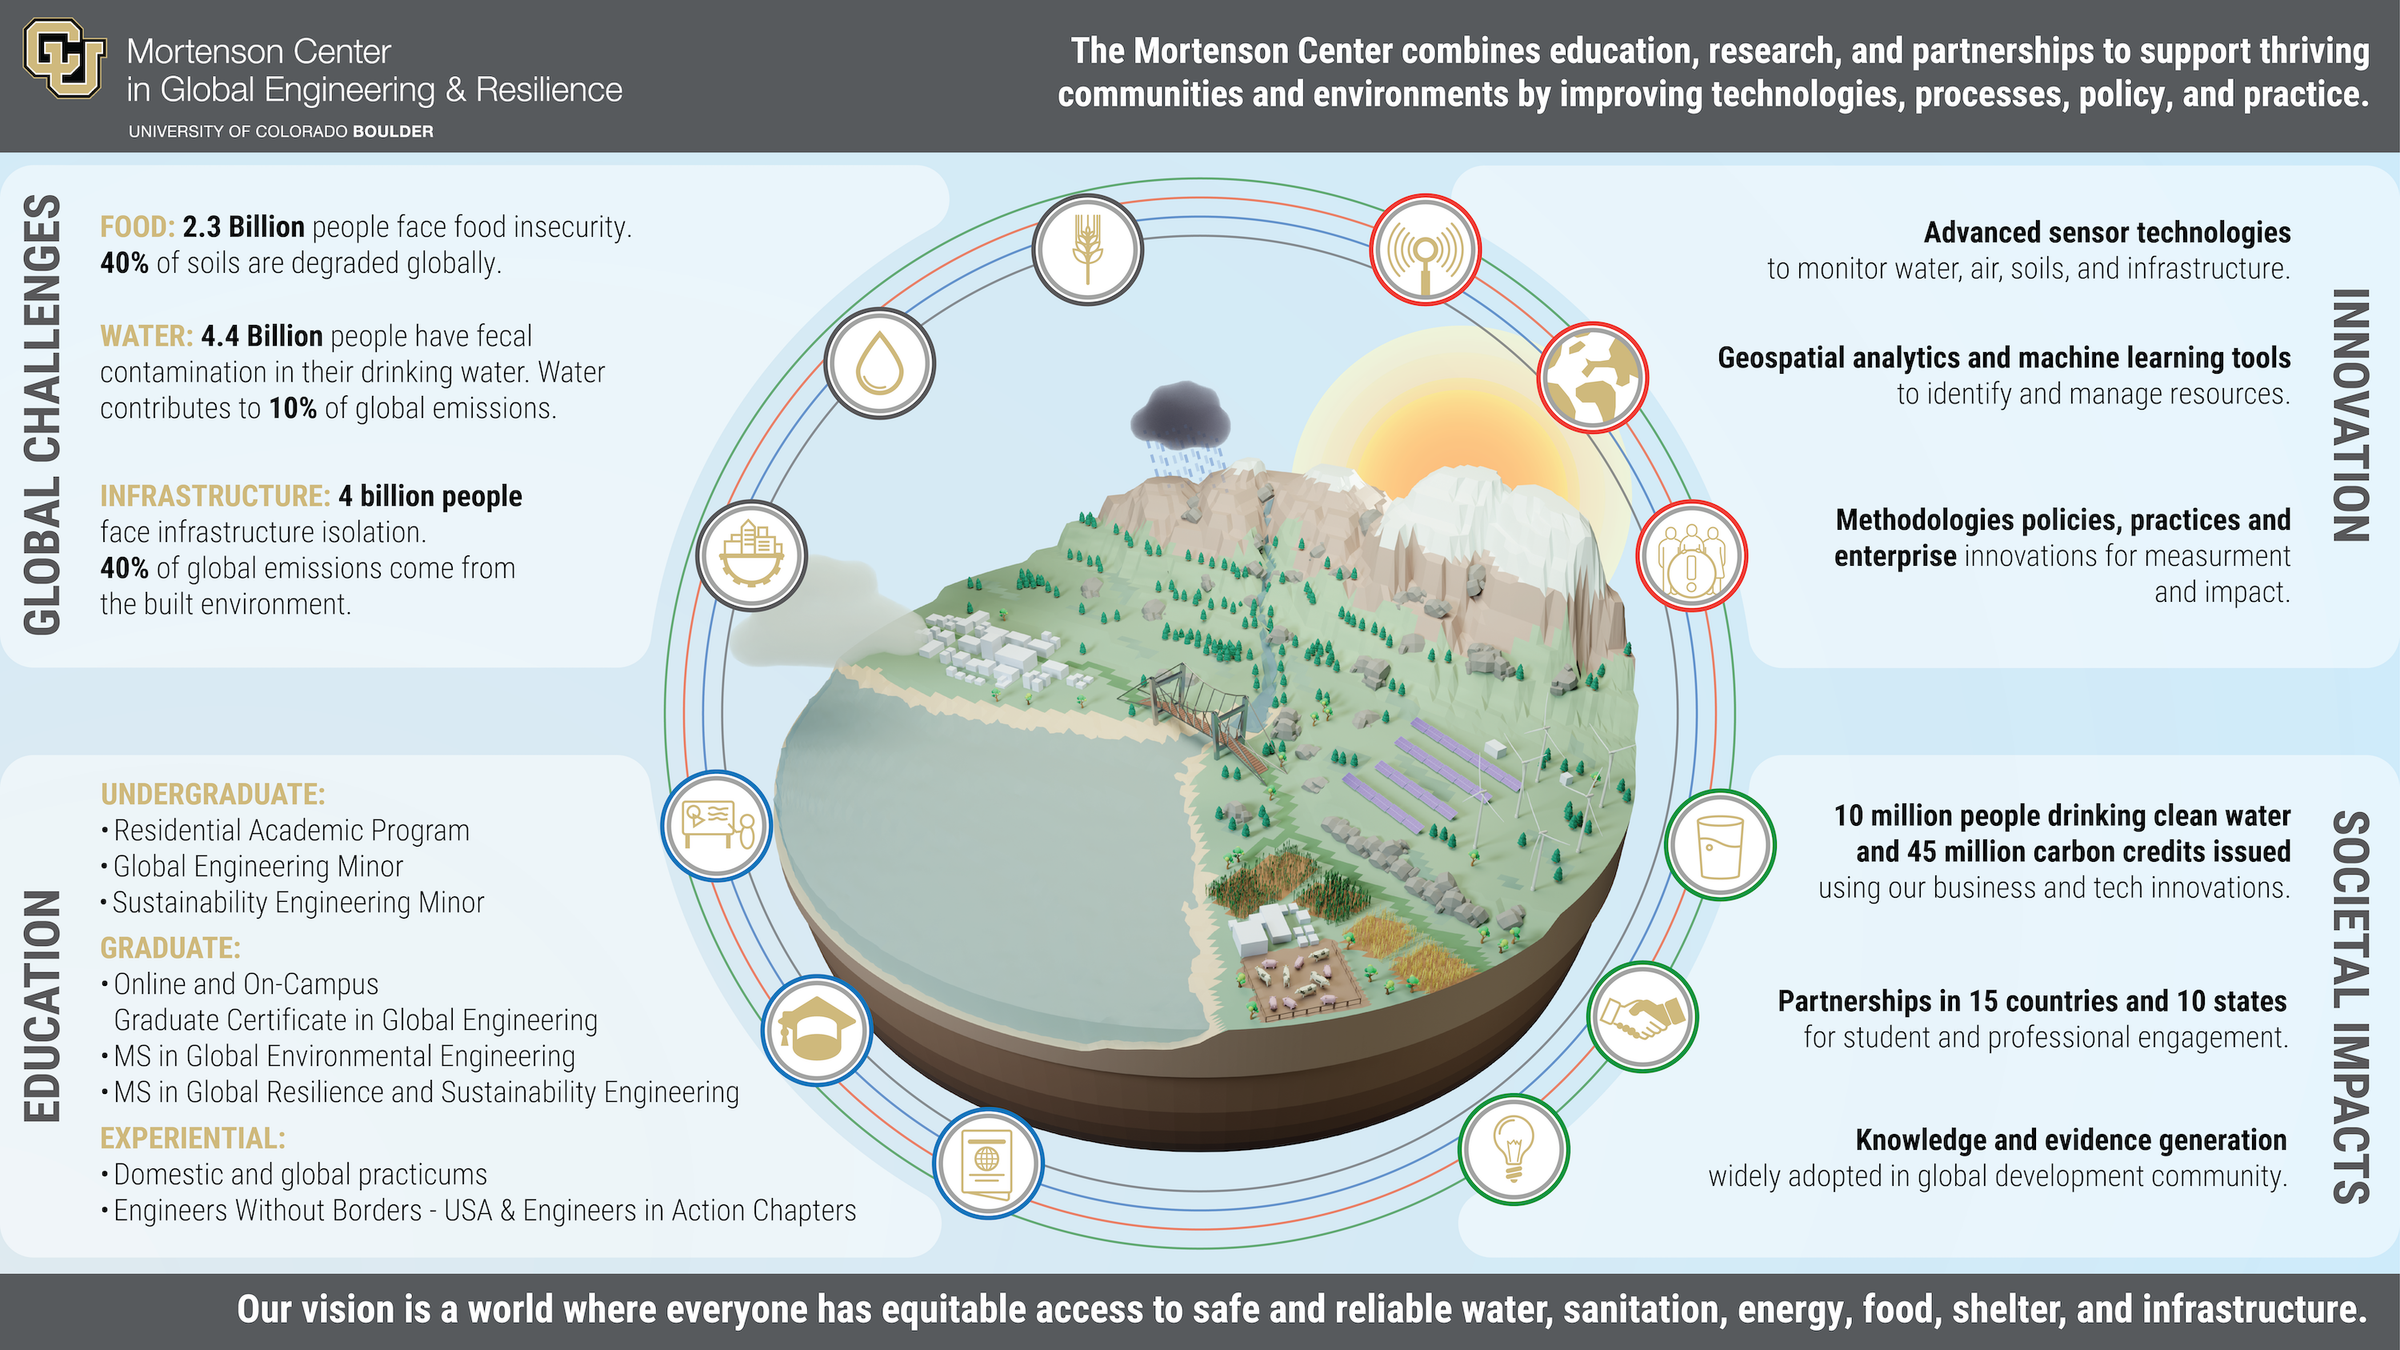
Introduction to Global Engineering
EVEN 2909: Introduction to Sustainability Engineering
Evan A. Thomas, PhD, PE, MPH — University of Colorado Boulder — Fall 2026
Course Overview
- Everything lives on the course website: sustainability-engineering.pages.dev — syllabus, weekly modules, slides, labs, assignments, and readings
- Required text: The Divide by Jason Hickel — PDF available on the course site
- Recommended: The Global Engineers (Thomas) and Drawdown (Hawken)
- Grading: attendance (30%), discussions & essays (30%), design project (15%), labs & presentations (25%)
- Labs are conducted in class, on east campus, and as homework — Environmental Solutions, EnRoads, Star Power, and the Lume Water Quality Lab
- Group presentation slides are submitted directly on the Environmental Solutions lab page
- Canvas is used for grades and announcements
Evan Thomas, Professor
Environmental Engineering Program, CEAE Dept, Aerospace Engineering Dept
Mortenson Endowed Chair in Global Engineering, Director
Education
- PhD, Aerospace Engineering
- MBA, Fletcher School, Tufts University
- MPH, Oregon Health & Science University
- PE, Professional Engineer
Experience
- NASA Johnson Space Center
- Portland State University
- DelAgua Health
Accomplishments
- 87 refereed journal publications
- 7 patents
- 5 books/chapters
- 2 pieces of legislation
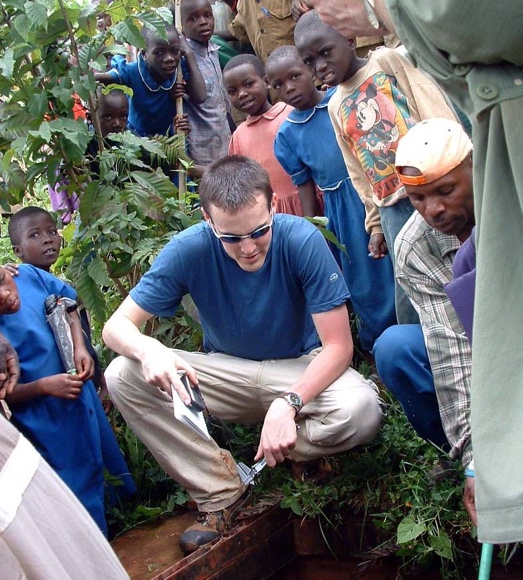

"Why are you here? At CU? In Engineering? In this class? What are you hoping to gain?"
World Geography Exercise
How well do you know the world map?
Geography Challenge
Map the World
Working in small groups, you will receive unmarked maps. Your task:
- Form groups of 3–4 students
- Receive blank, unmarked maps of the world and Africa
- Fill in as many country names as you can in 5–10 minutes
- Compare results across groups
This exercise reveals gaps in geographic knowledge that are common among engineering students — and demonstrates why global context matters for sustainability work.
The Global Context
Images from communities around the world where sustainability engineering matters most.
DR Congo & Field Context

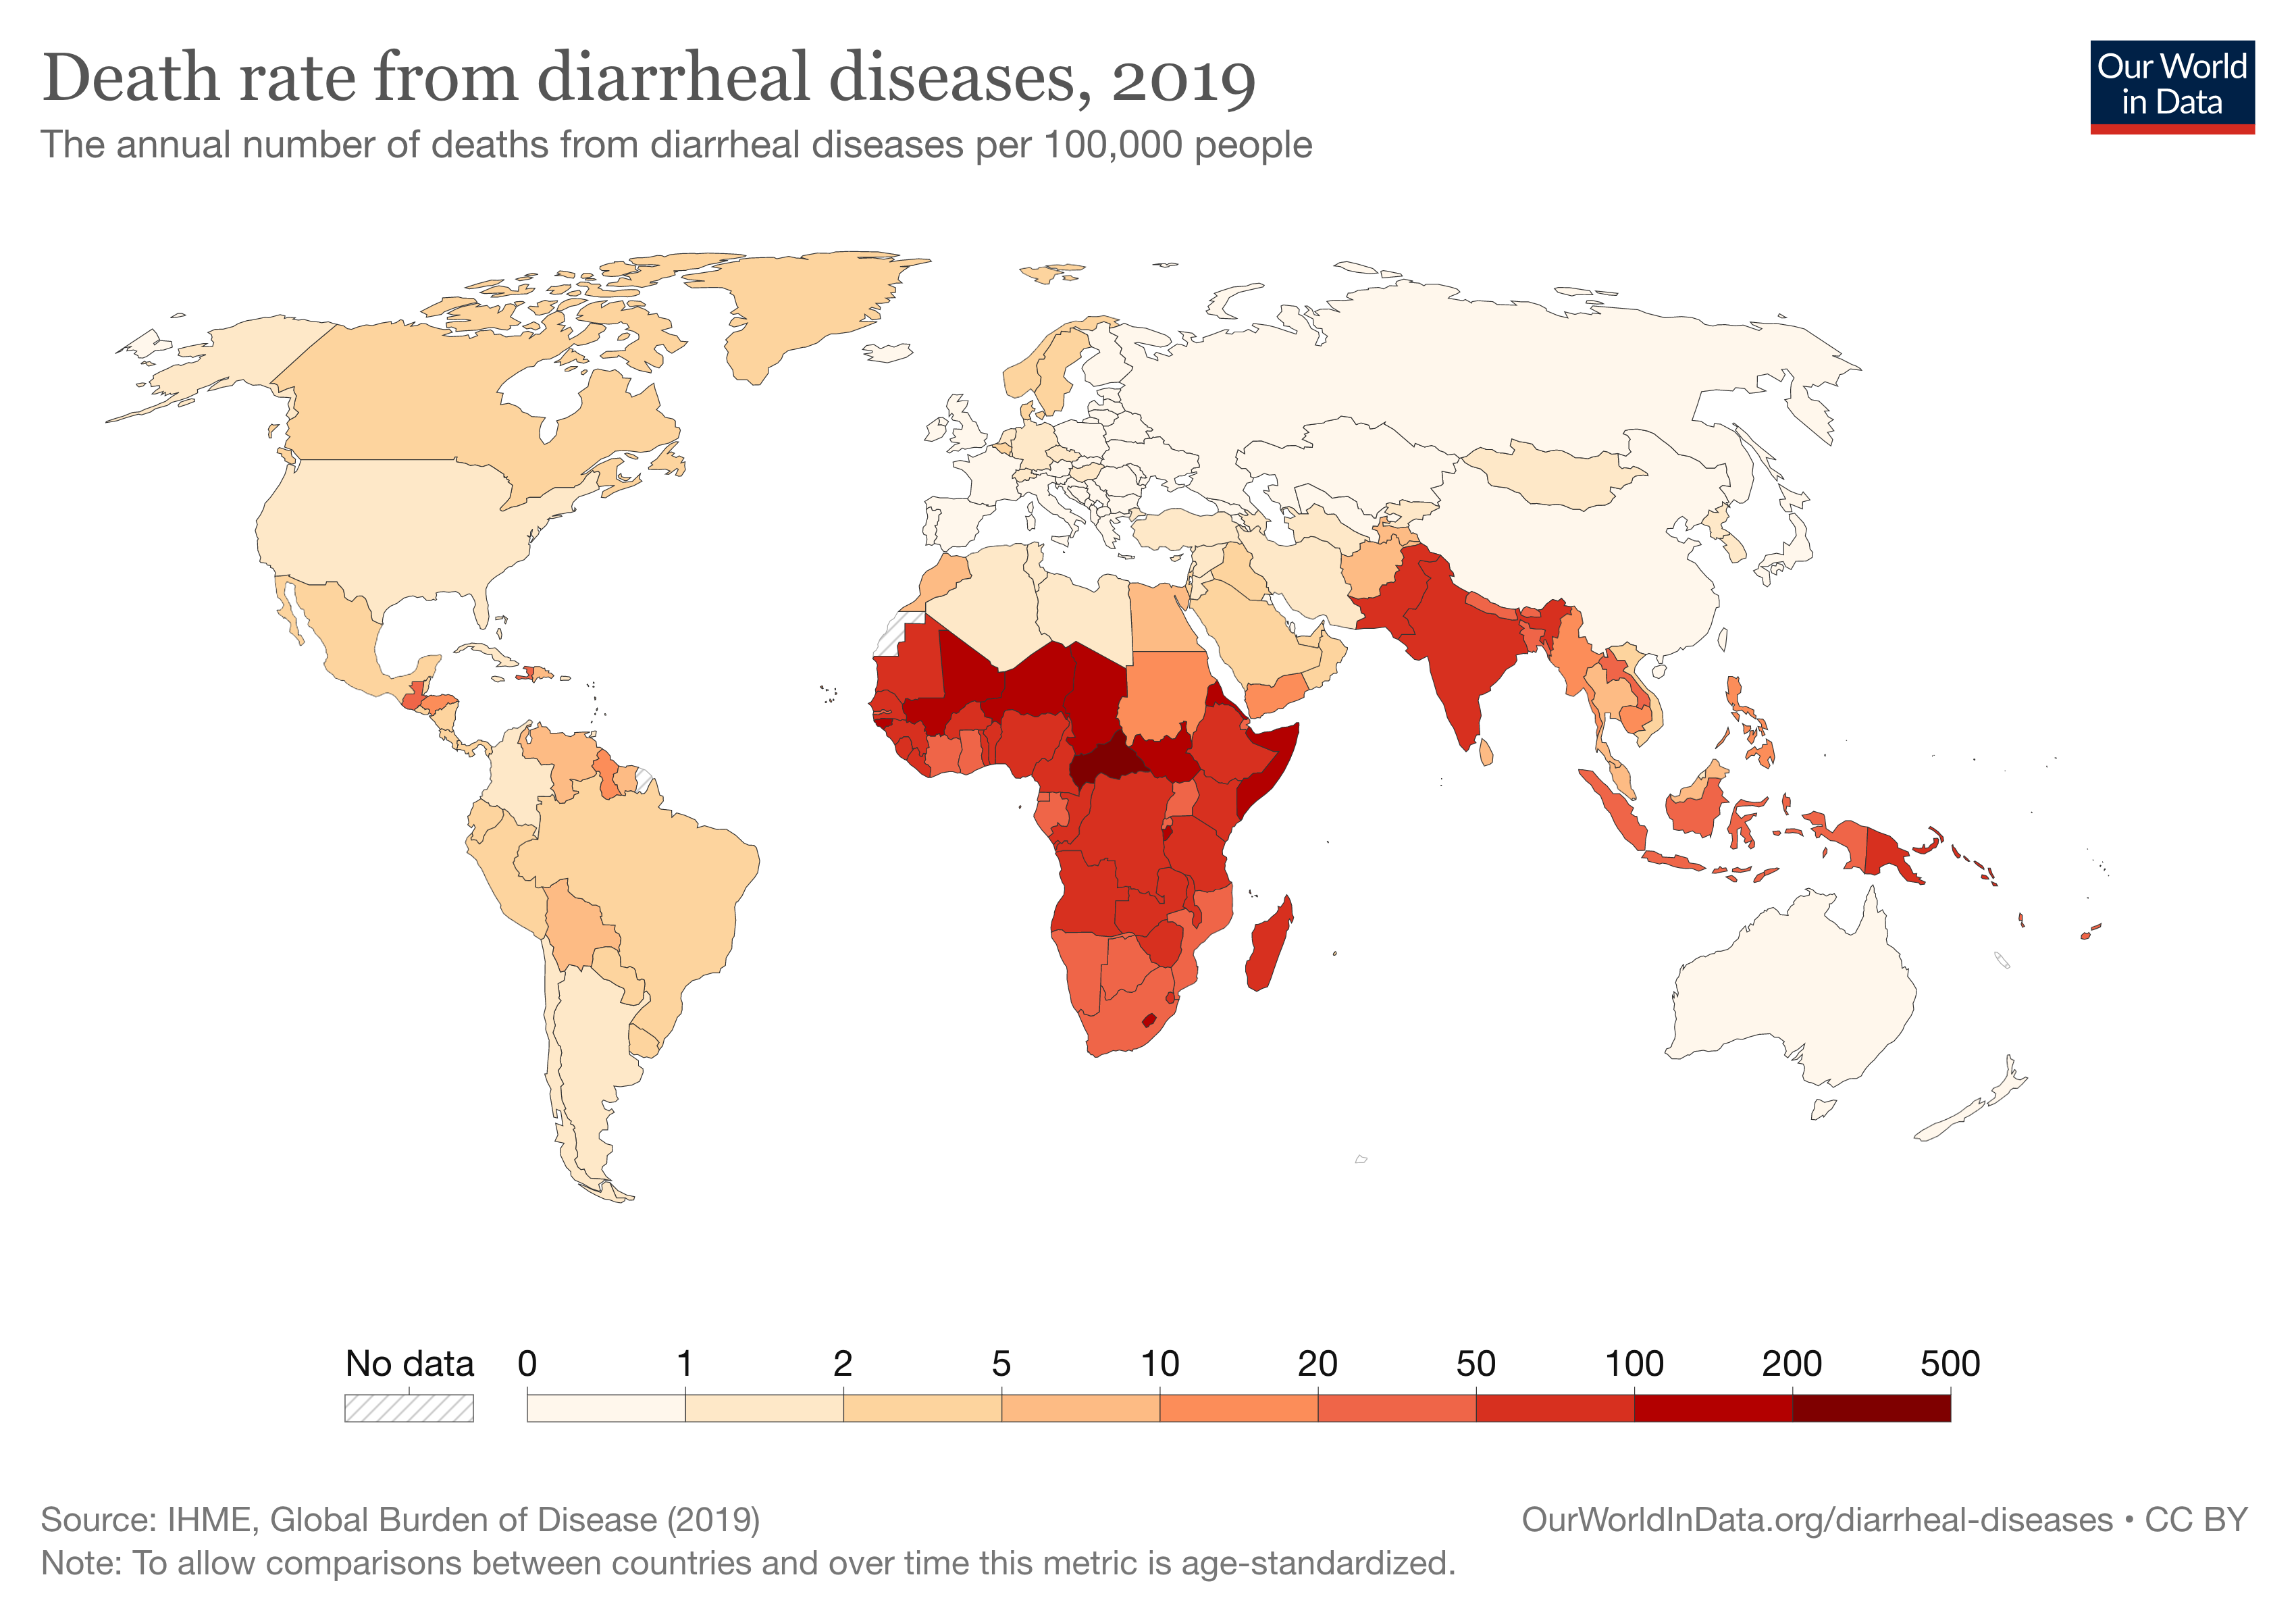

Global Burden of Disease
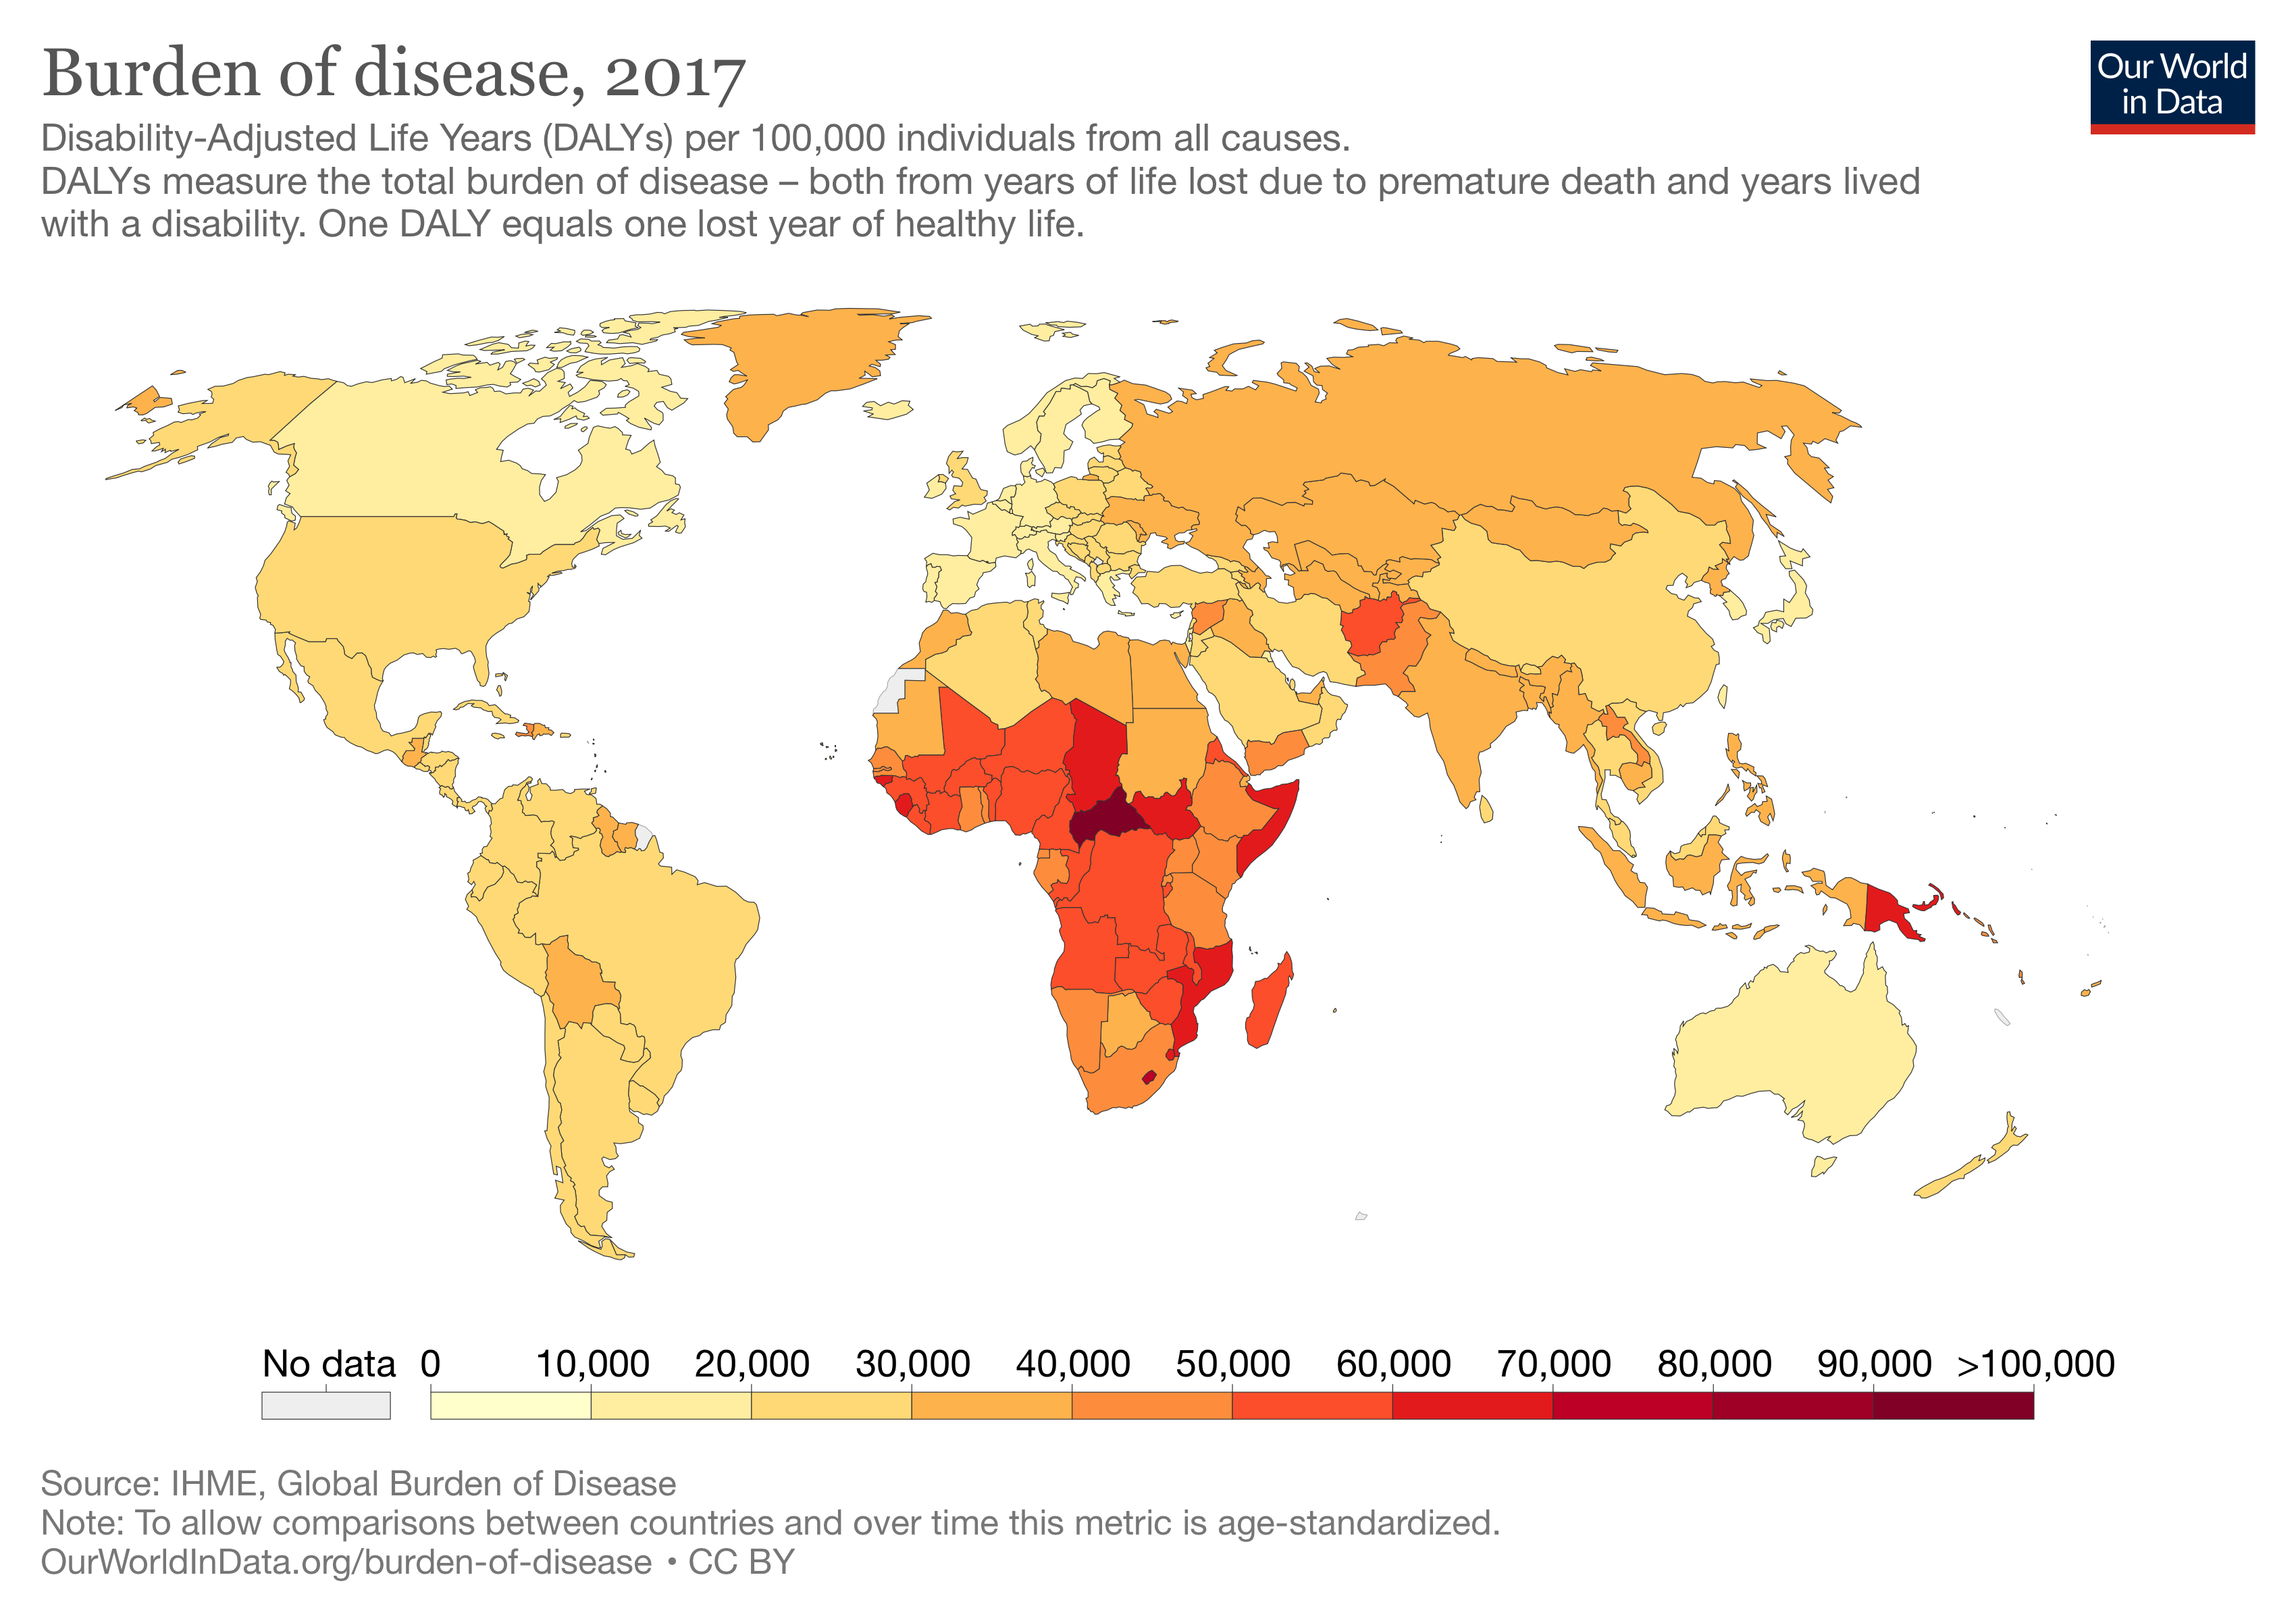
Understanding the scale of the challenge.
Global Burden of Disease
Explore the data at healthdata.org
What is Poverty?
According to the United Nations:
Income Poverty
Family income below a federally established threshold.
International Poverty Line
$1.90 per day, adjusted for purchasing power parity (PPP).
Absolute Poverty
The amount of money necessary to meet basic needs: food, clothing, and housing.
Relative Poverty
Defined in relation to the economic status of others in society.
"Poverty is hunger. Poverty is lack of shelter. Poverty is being sick and not being able to see a doctor. Poverty is not having access to school and not knowing how to read." — United Nations
Today, poverty is understood as social, political, and cultural — not merely economic.
What is Global Development?
Goals, actors, models, and the evolution of development thinking.
What is Global Development?
Overall goal: Improve quality of life, health, education, and opportunities for impoverished people.
Foreign Aid
Financial assistance from a donor country or agency, as grants or loans.
Grassroots / Participatory Development
Driven by small non-profits, cooperatives, and businesses at the community level.
Key insight: Small and medium NGOs are not necessarily structurally different from multilateral organizations. Most funding comes from linear financing — charity, donation, and aid without sustained feedback loops.
Who Does Global Development?
Broad fields include Global Health, Global Development, Global Engineering, and Poverty Reduction. There is no single "right" answer, but a great deal has been learned. Many disciplines are involved:
Development Models
Historically
- Top-down approaches with large infrastructure projects
- Programs often failed due to lack of community buy-in, participation, education, and revenue
Today
- Grassroots, community participation considered best practice
- Sustainability: Meeting the needs of the present without compromising the ability of future generations to meet their own needs
History of International Development
Five broad stages from colonialism to the SDGs — shaped by failed experiments, slow learning, and persistent debate.
Development Policy Timeline (Part 1)
There is no definitive textbook on the history of international development. Policies have moved from simple to complex through failed experiments, slow learning, and groupthink.
- Extraction of resources from colonized territories
- Imposed economic and political structures
- Legacy continues to shape development challenges today
- World Bank and IMF established at Bretton Woods (1944)
- United Nations created (1945)
- Universal Declaration of Human Rights (1948)
- Cold War — spheres of influence; "Third World" originally meant non-aligned countries
- De-colonization began; nationalization of resources and industries
- Infrastructure focus driven by industrialization; "trickle down" economic growth
- Large multilateral aid agencies dominated
- Development as modernization — "catching up" with the West
- Focus on macro indicators like GDP growth
- "First Decade of Development" (1960s, per JFK)
- Little attention to social development or local context
- Marshall Plan for Europe used as template (but different context)
- Theoretical basis: Rostow's stages of economic growth
Development Policy Timeline (Part 2)
- Growing liberalism in the West; cultural relativism, rejection of Western dominance
- Oil price rise, economic contraction
- Dependency theory — aid viewed as imperialism
- Interest in local context — participatory development emerges
- Basic Human Needs approach: healthcare, education, water, sanitation
- Emergence of "appropriate technology" concept
- Small is Beautiful (Schumacher, 1973)
- Robert Chambers and participatory rural appraisal
- Women in development discourse begins
- Environmental concerns emerge (Club of Rome, Limits to Growth)
- Economic slowing and shocks; potential collapse of states due to debt
- Cold War peak and eventual end — collapse of Soviet bloc
- Washington Consensus: fiscal discipline, reduced spending, open markets, trade liberalization
- World Bank/IMF structural adjustment programs
- Privatization of state enterprises
- Rise of NGO sector; good governance agenda
- Shift to conditionality in aid
- Human Development Index introduced (UNDP)
- Rio Earth Summit (1992) — sustainable development
- Growing criticism of structural adjustment
- Recognition that markets alone are insufficient
- Emergence of rights-based approach
Development Policy Timeline (Part 3)
- Continuing democratization; multi-pole power structure (BRICs)
- New calls for better global governance
- MDGs (2000–2015): 8 goals with measurable targets
- SDGs (2015–2030): 17 goals, 169 targets, universal framework
- Paris Agreement on climate (2015)
- Accra Agenda for Action — aid effectiveness: ownership, alignment, harmonization
- Rise of South-South cooperation
- Growing role of private sector and impact investing
- Digital revolution and data for development
- Localization agenda
- Climate change as a central development issue
- COVID-19 pandemic impact
- Rise of populism and nationalism
- From charity to partnership; aid to cooperation
- From doing good to doing evidence-based good
Foreign Aid: Does It Work?
$2.3 trillion in aid over decades — what has it achieved?
Foreign Aid Works (?)
- 440 million vaccinations delivered
- Malaria reduction: 360 million bednets distributed
- HIV/AIDS reduction: 6.1 million people on antiretroviral therapy
- A billion people lifted out of poverty in 50 years
- Dramatic improvements in child survival, literacy, and life expectancy
- Not all progress is attributable to aid
- Some countries and situations are worse off
- Dependency on external funding
- Corruption and market distortion
- $2.3 trillion in aid with limited accountability
- Structural issues remain unaddressed
The key question for sustainability engineers: How do we move from doing good to doing evidence-based good? How do we design interventions that are sustainable, locally owned, and measurably effective?
Public Health Engineering
Engineering solutions for the world's most pressing sustainability challenges.
Global Water Security
Analytics to Action
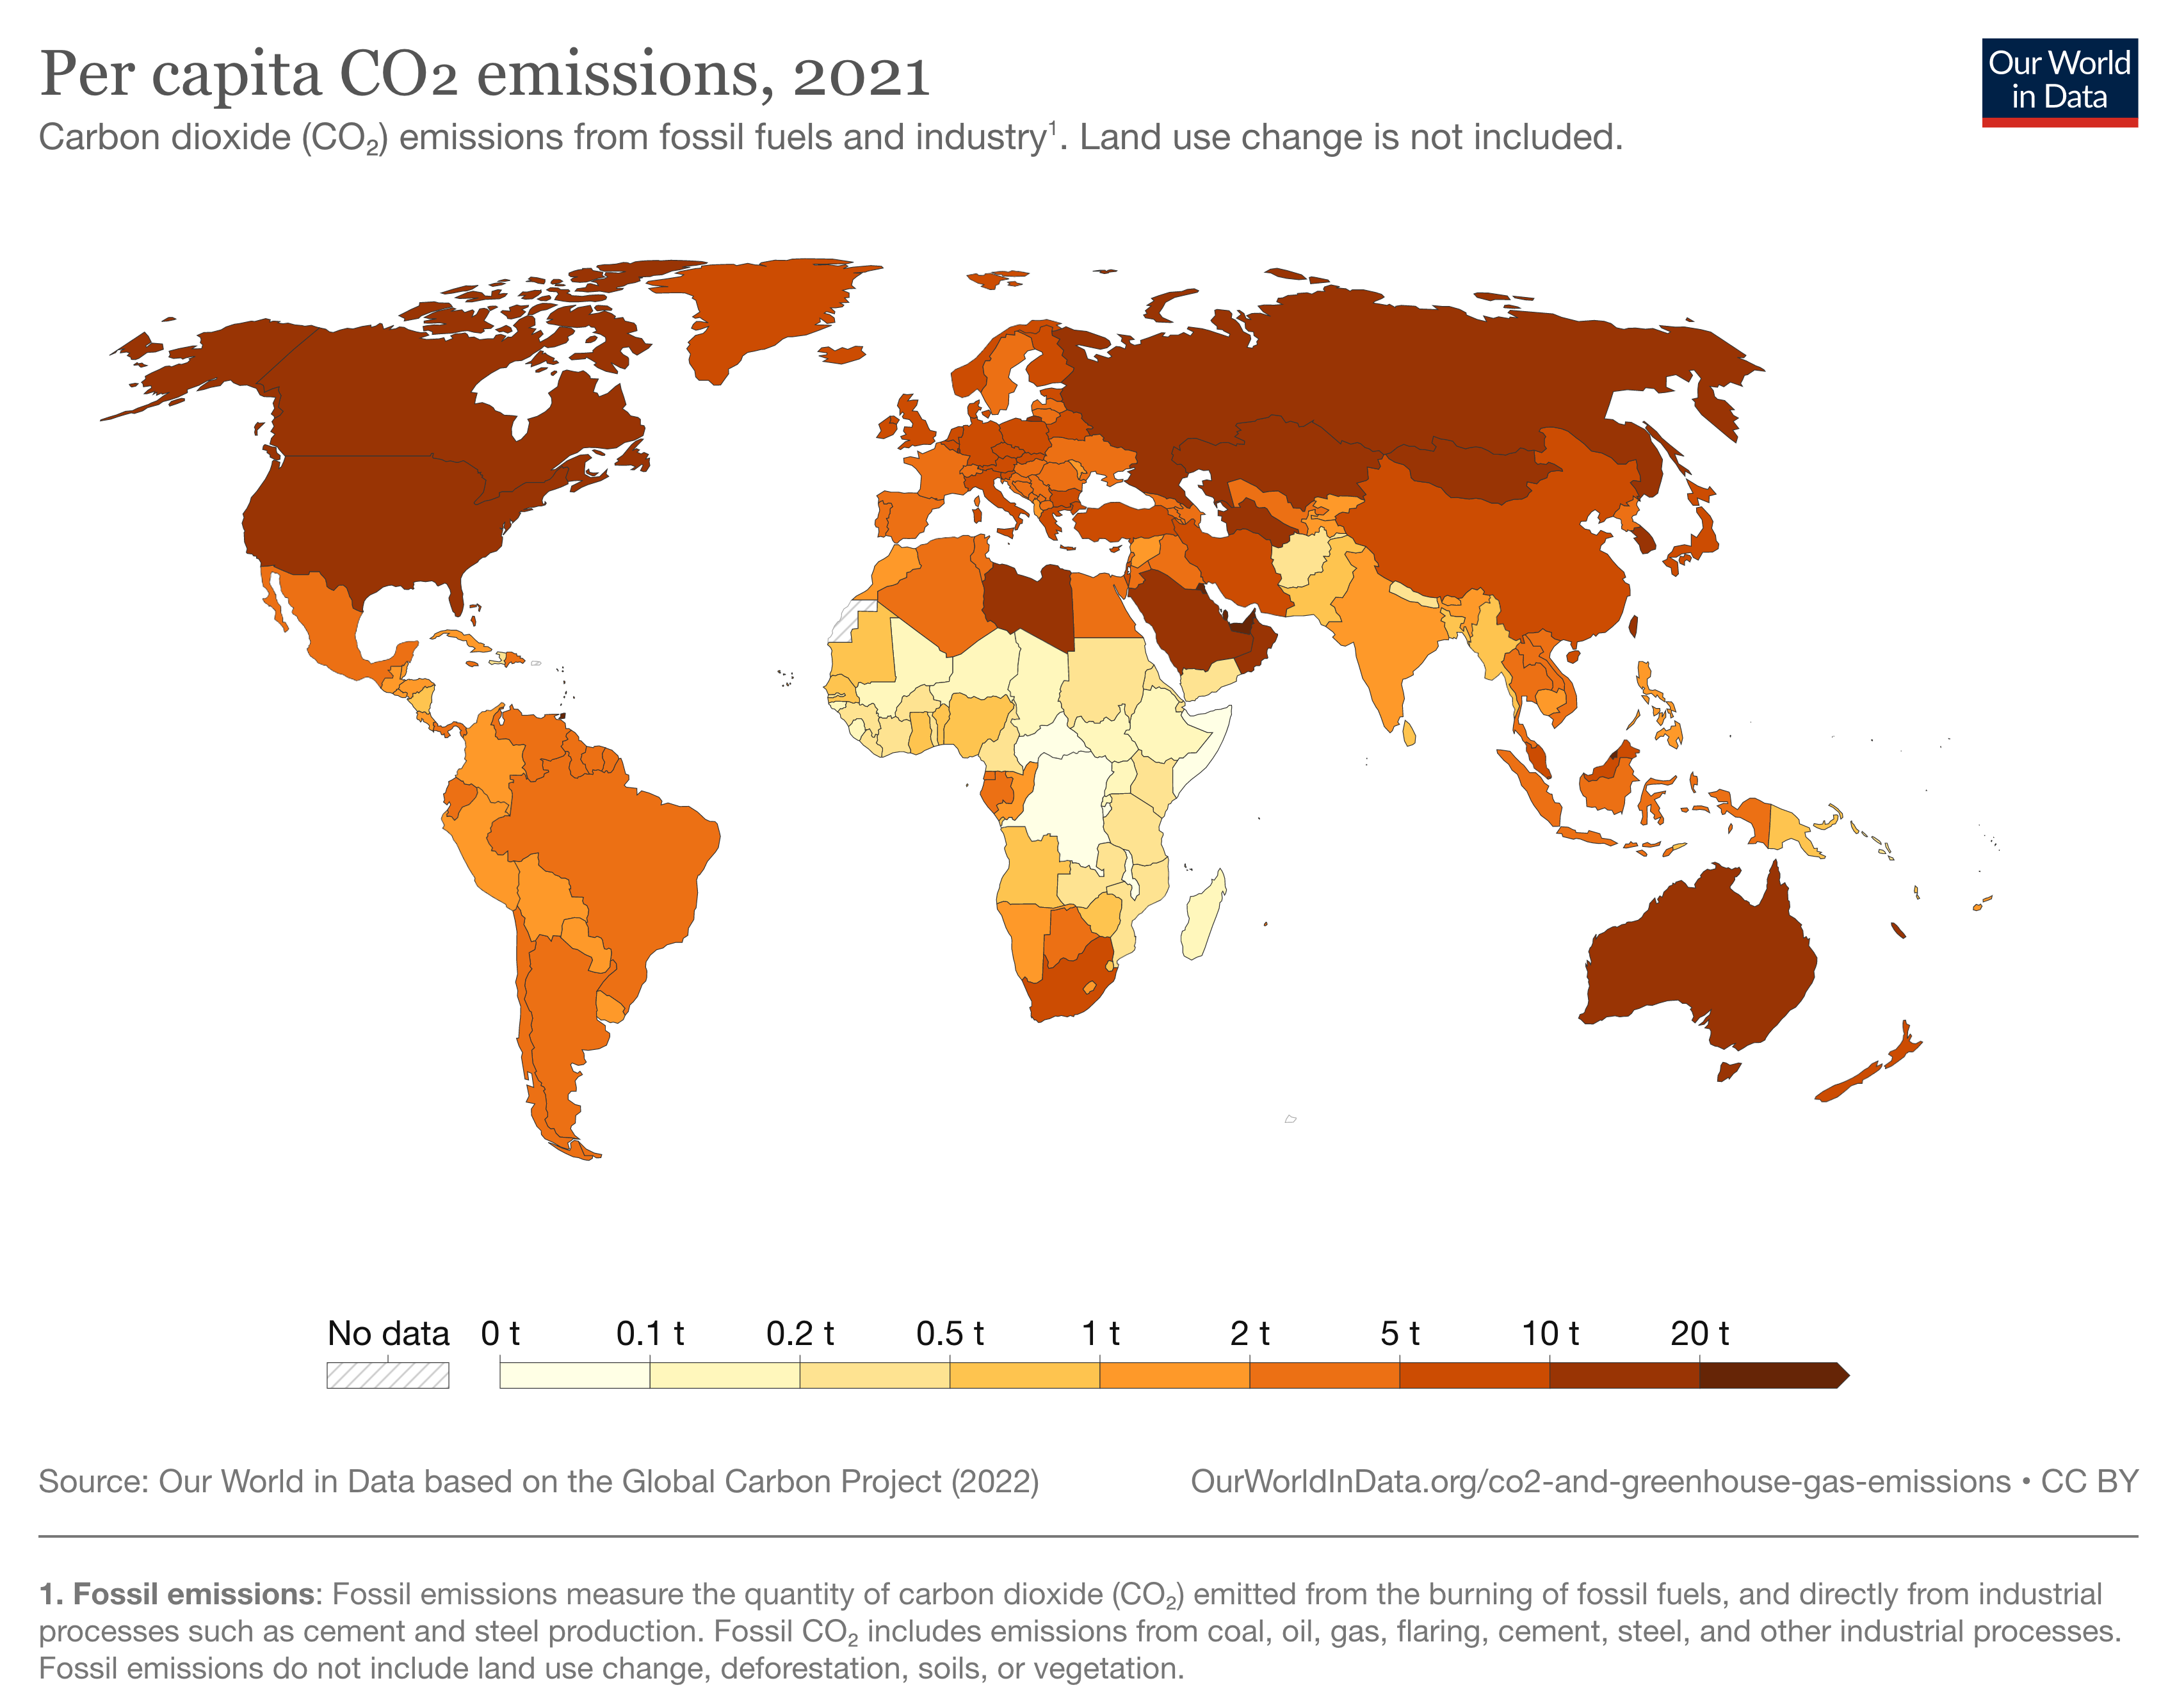
Per Capita CO2 Emissions
High-income countries have the highest per capita emissions, while low-income countries with the greatest disease burden contribute the least.
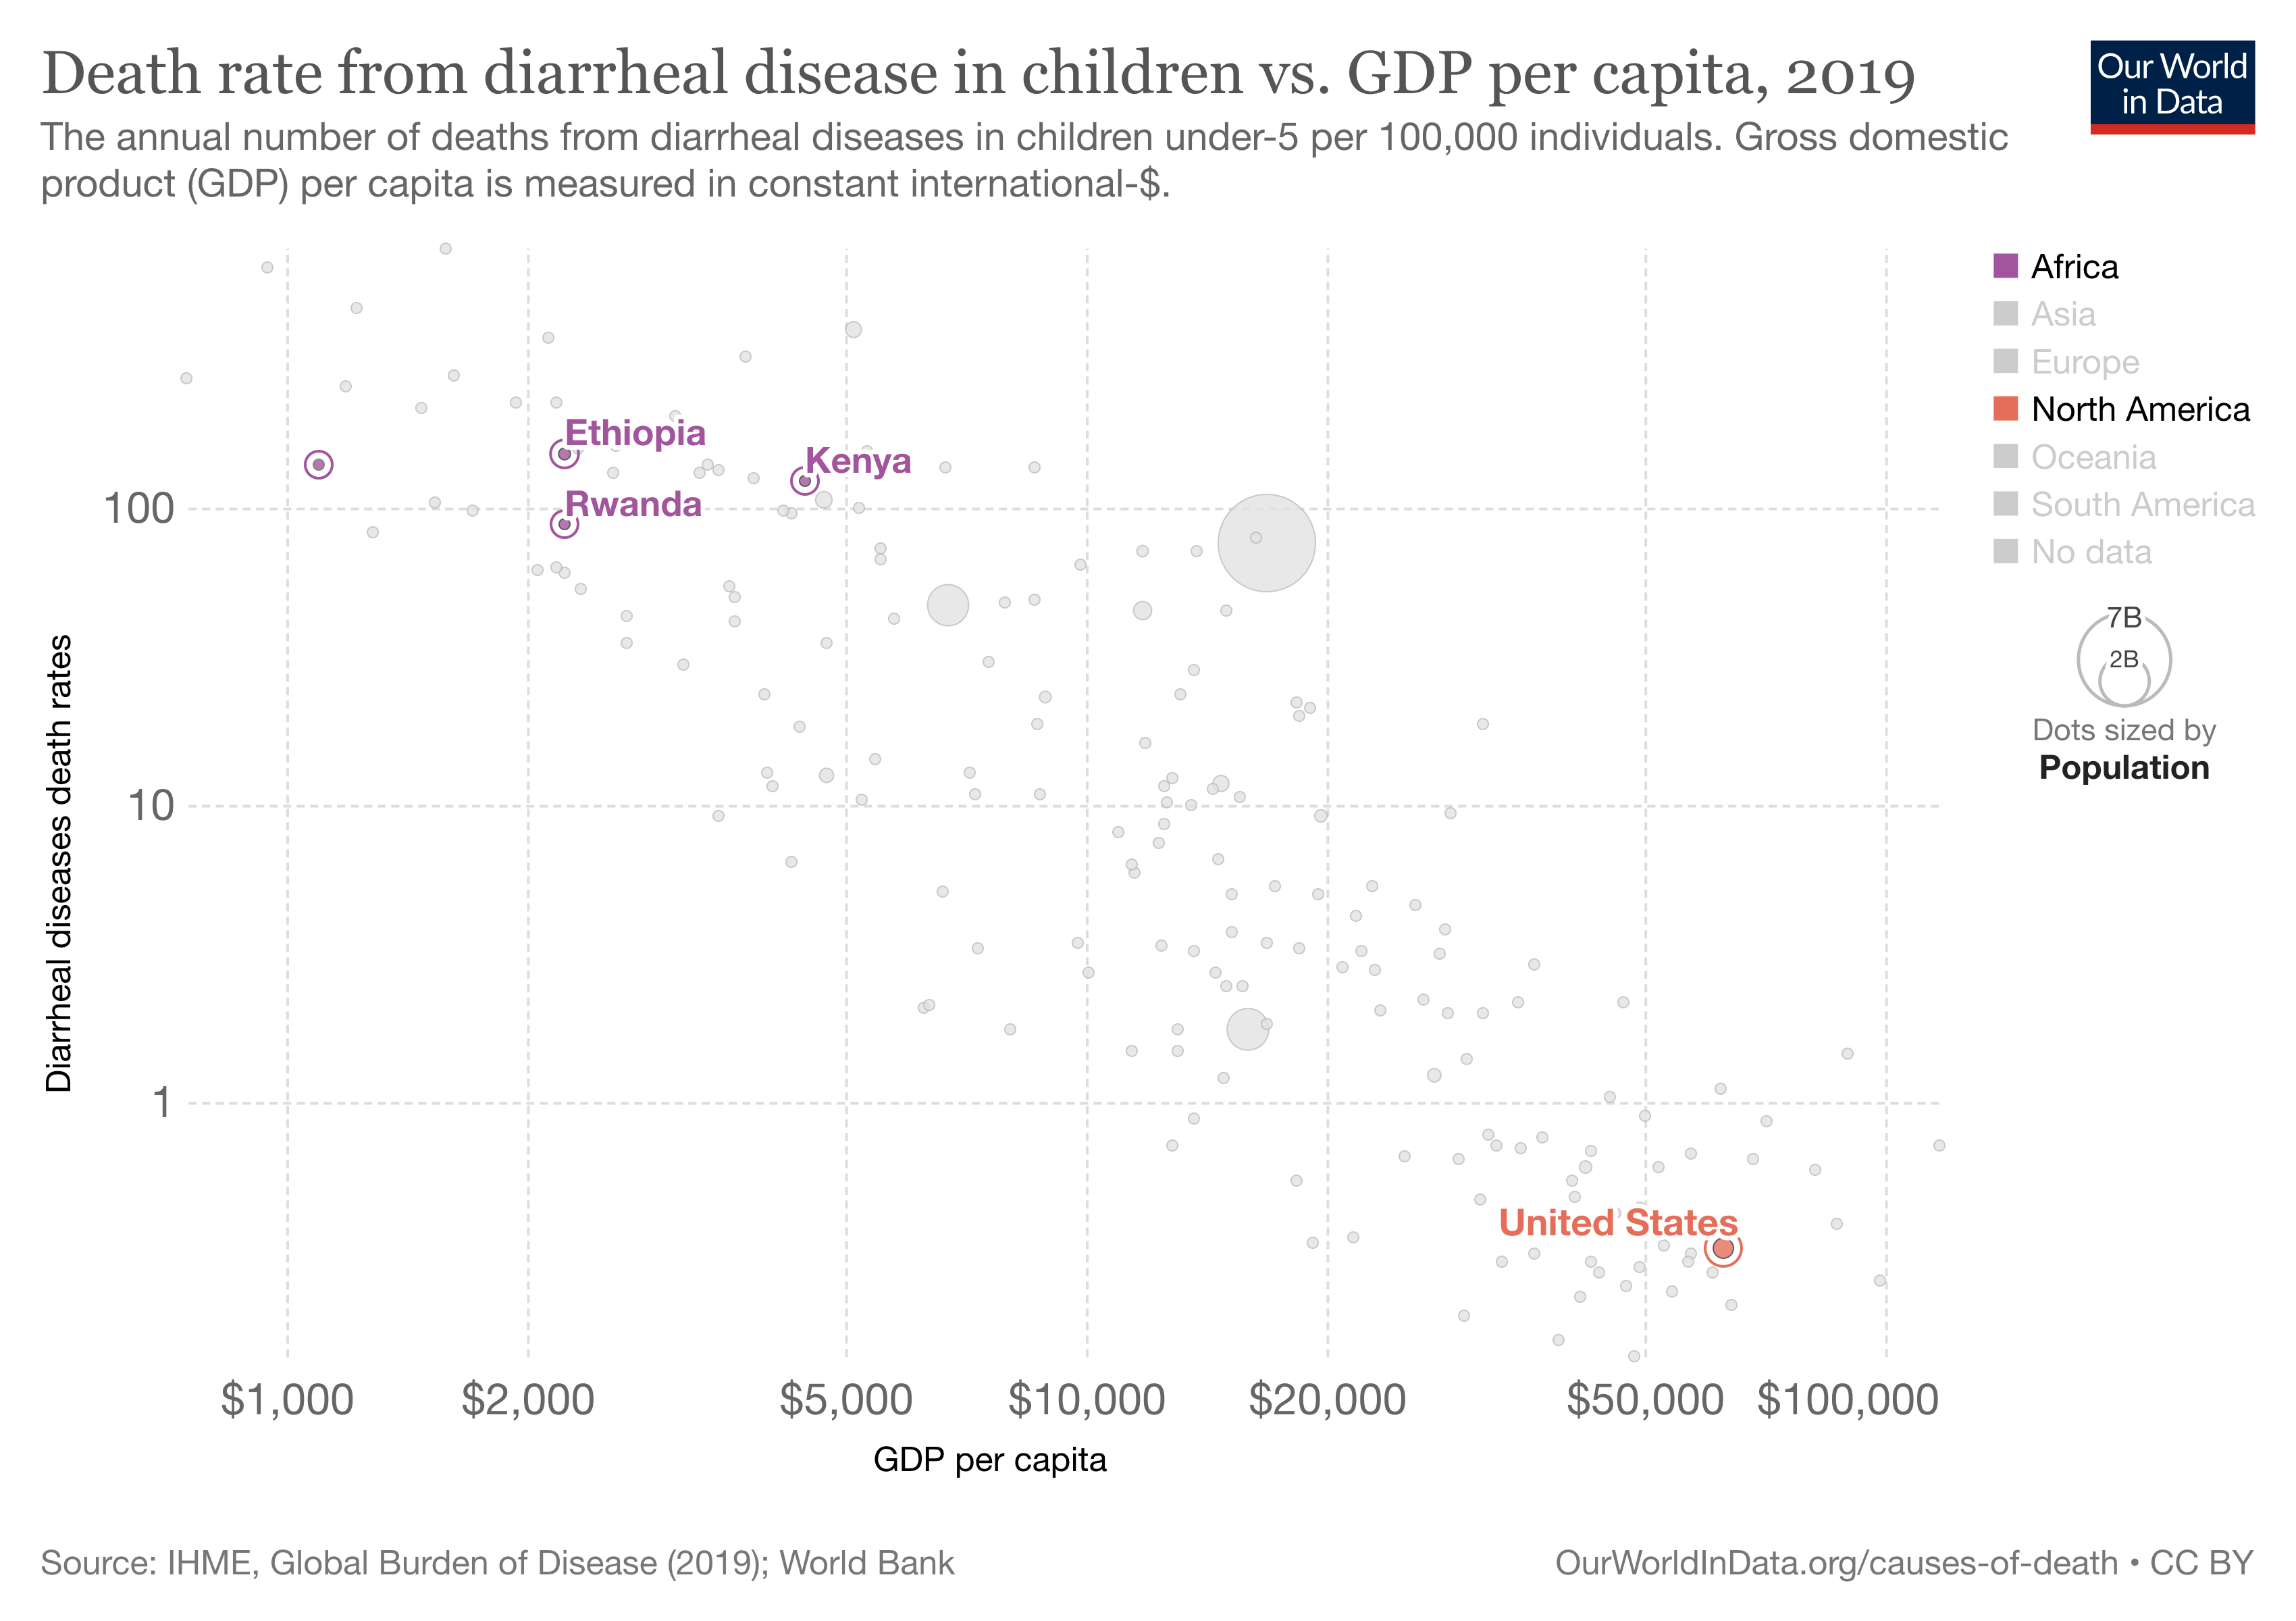
Death Rate from Diarrhoeal Diseases
Annual deaths per 100,000, all ages. Disease burden tracks fecal contamination — Sub-Saharan Africa and South Asia carry it. Source: IHME GBD via Our World in Data.
Water Quality Impairment at Scale
drink microbially contaminated water
threatened by water insecurity
half from water management, half from unmanaged human wastewater
fail Clean Water Act standards
Climate change is here — and the first thing most of us notice is what it's doing to our water. Dry places are becoming drier, with droughts driving crop failure, livestock death, and displacement. Wet places are becoming wetter, with flooding destroying communities and contaminating drinking water. Because of what we've done — through causing climate change and treating water as free — we can't count on water being where we need it, when we need it anymore.
Currently four billion people experience water stress. The United Nations projects that water insecurity will displace at least 700 million more people by 2030. By 2030 nearly five billion people will experience significant water stress because of climate change — and most of the time there is still plenty of water. The problem is we don't conserve and protect it so it's there when we need it most.
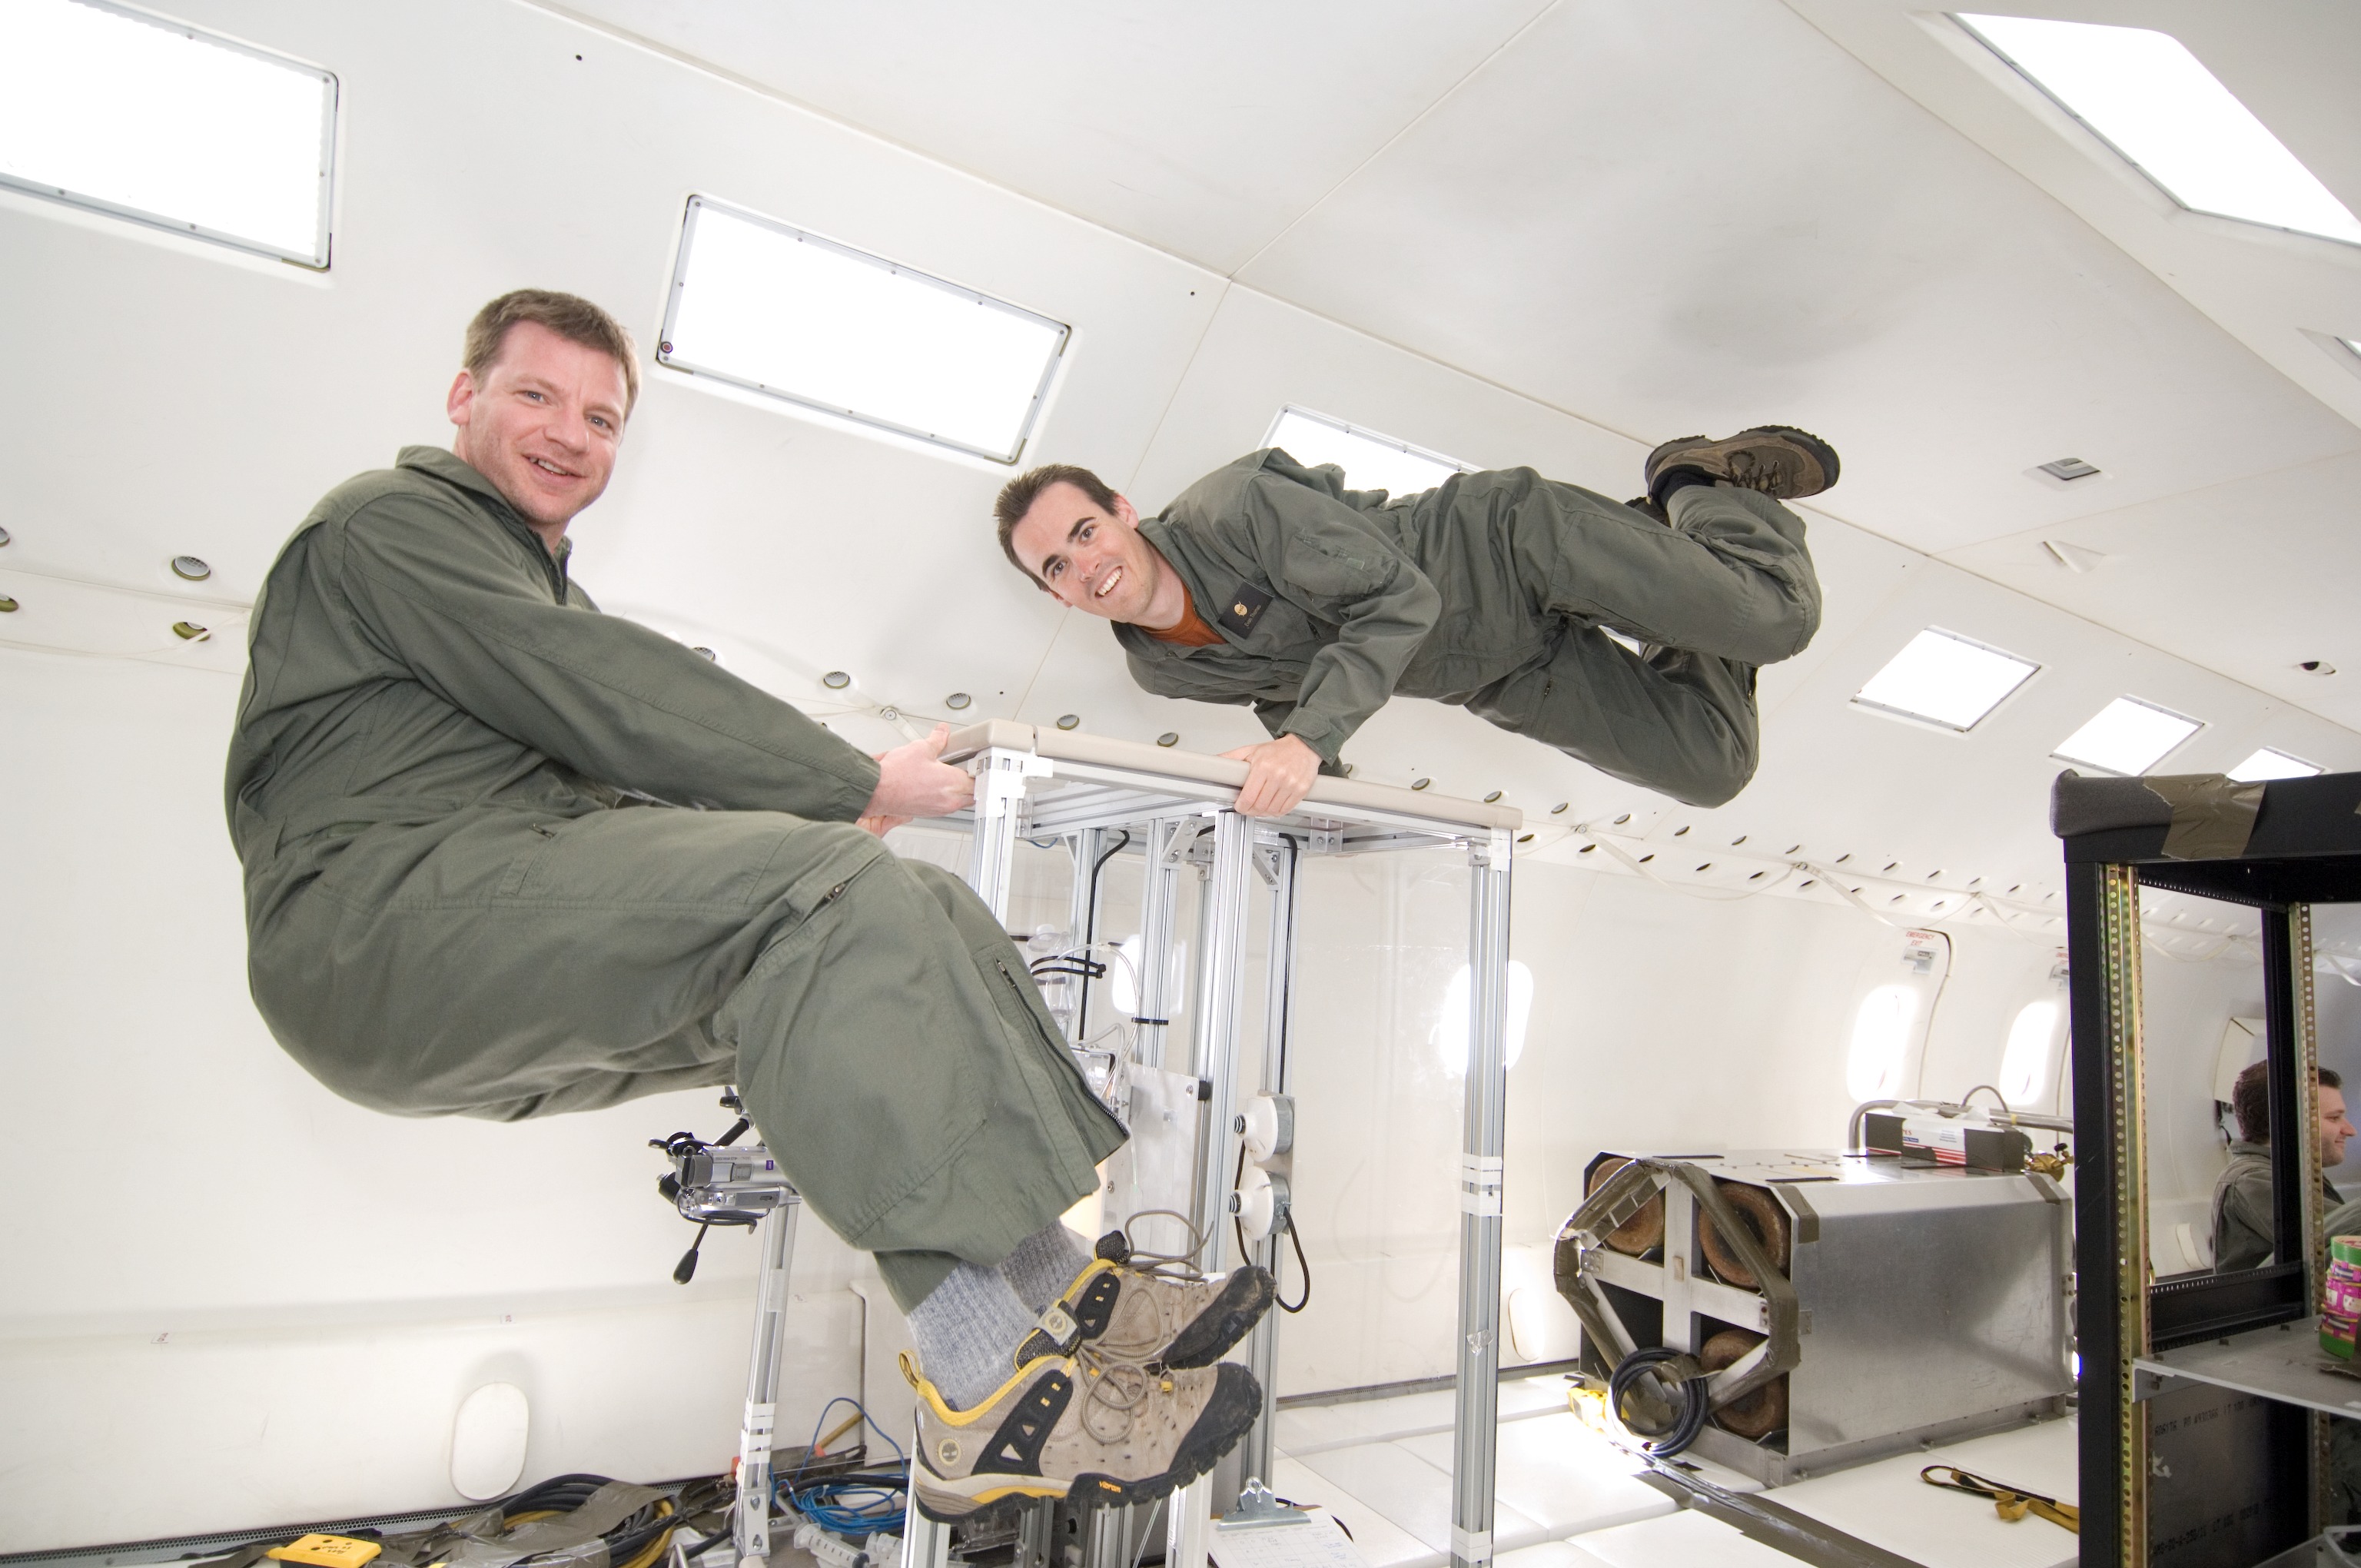
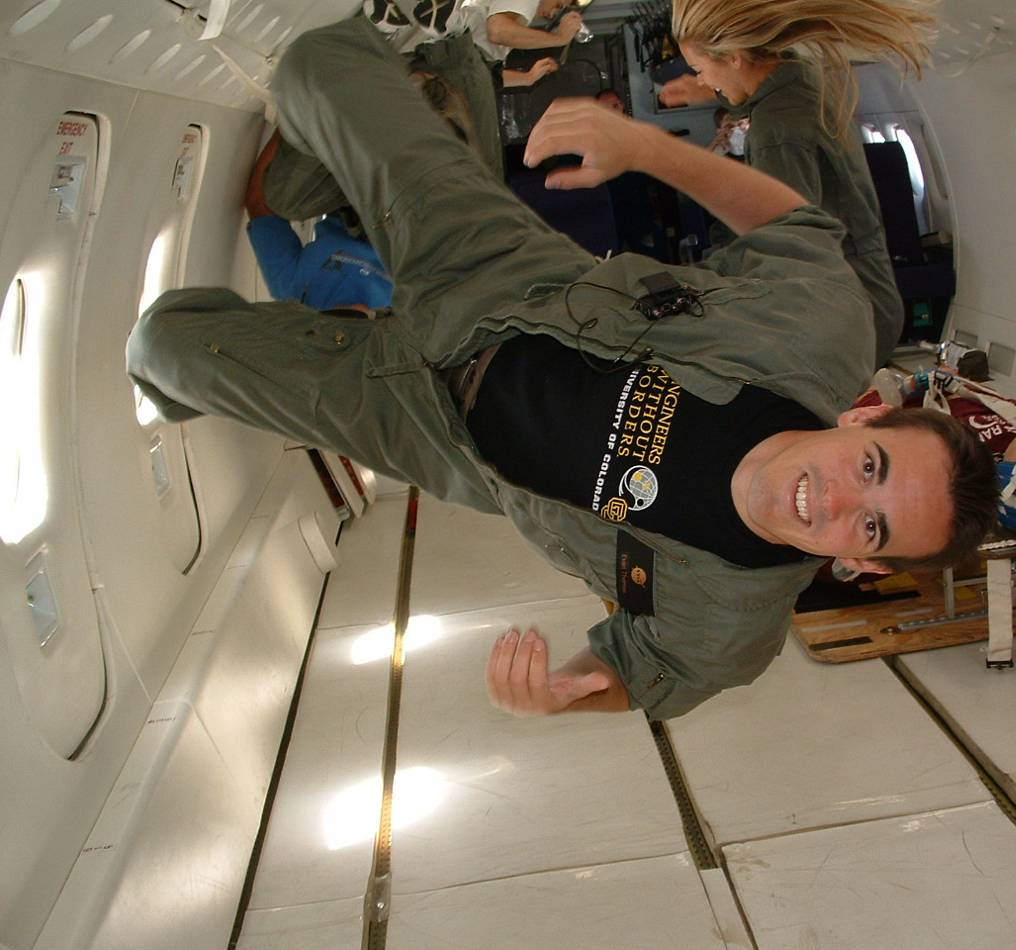
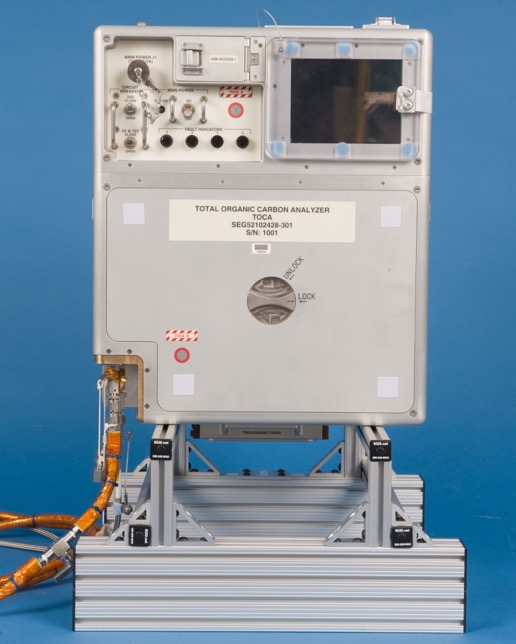
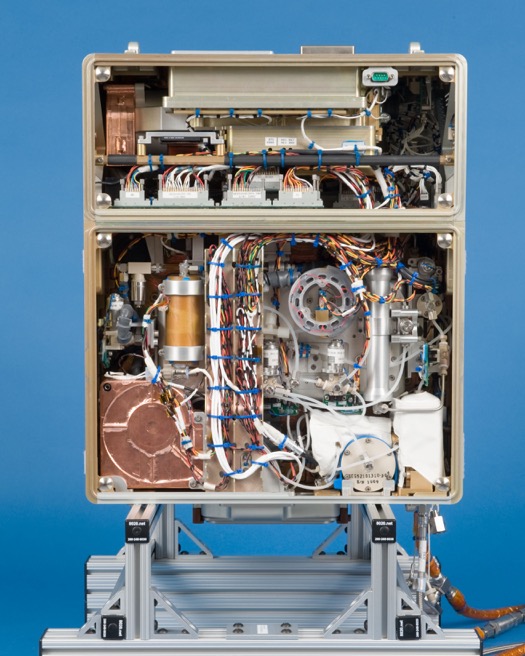
My early career was as an Aerospace Engineer at NASA in Houston, where I designed drinking water systems for astronauts. This is what NASA calls the "Weightless Wonder" — but since I don't work there anymore, I can call it by its real name: the Vomit Comet. This is where we test technologies in reduced gravity before sending them to space.
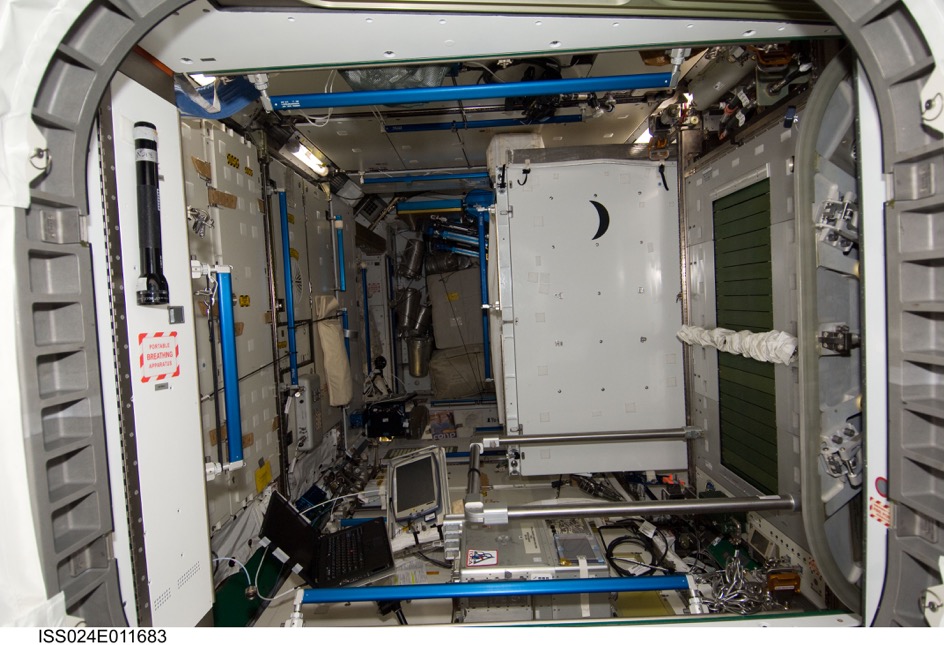
Astronauts on the Space Station need the same things we do — shelter, food, air, and clean water. But water is incompressible, so it's really hard to pack it down and send it up on a rocket. It costs about $20,000 per liter of water sent to the Space Station. So instead, we recycle it. Every day, we collect the respiration, perspiration, and urination of every astronaut and recycle it back into drinking water. Today's coffee was also your buddy's coffee yesterday. Even with all that engineering, it still costs several thousand dollars for every drink of water on the Space Station. Back here on Earth, we use it like it's free — until it's not.
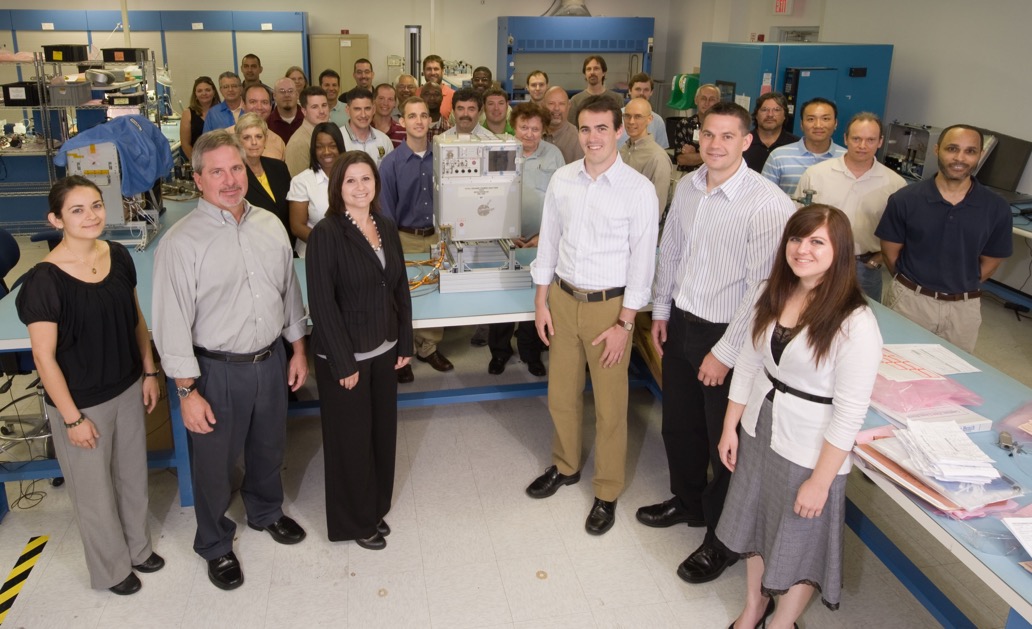
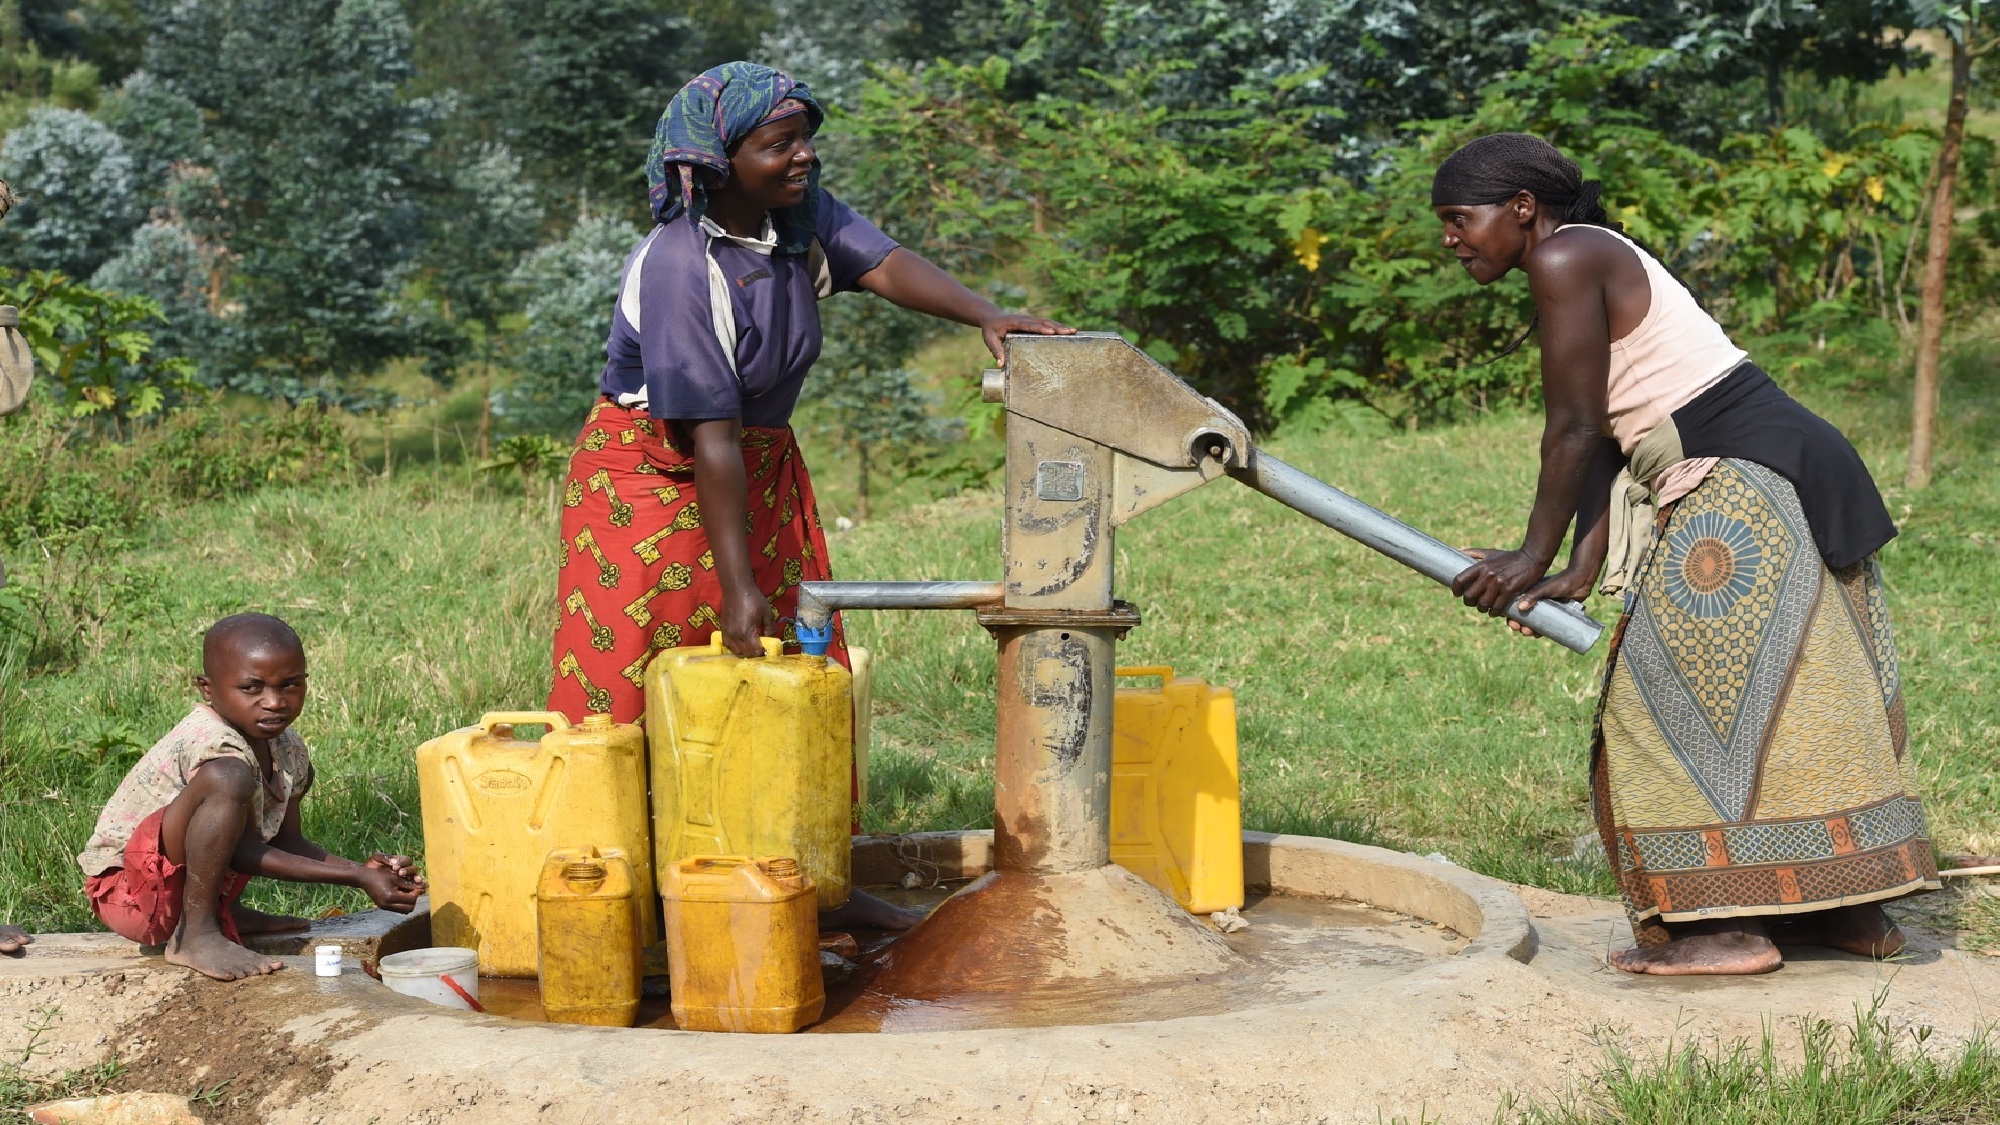
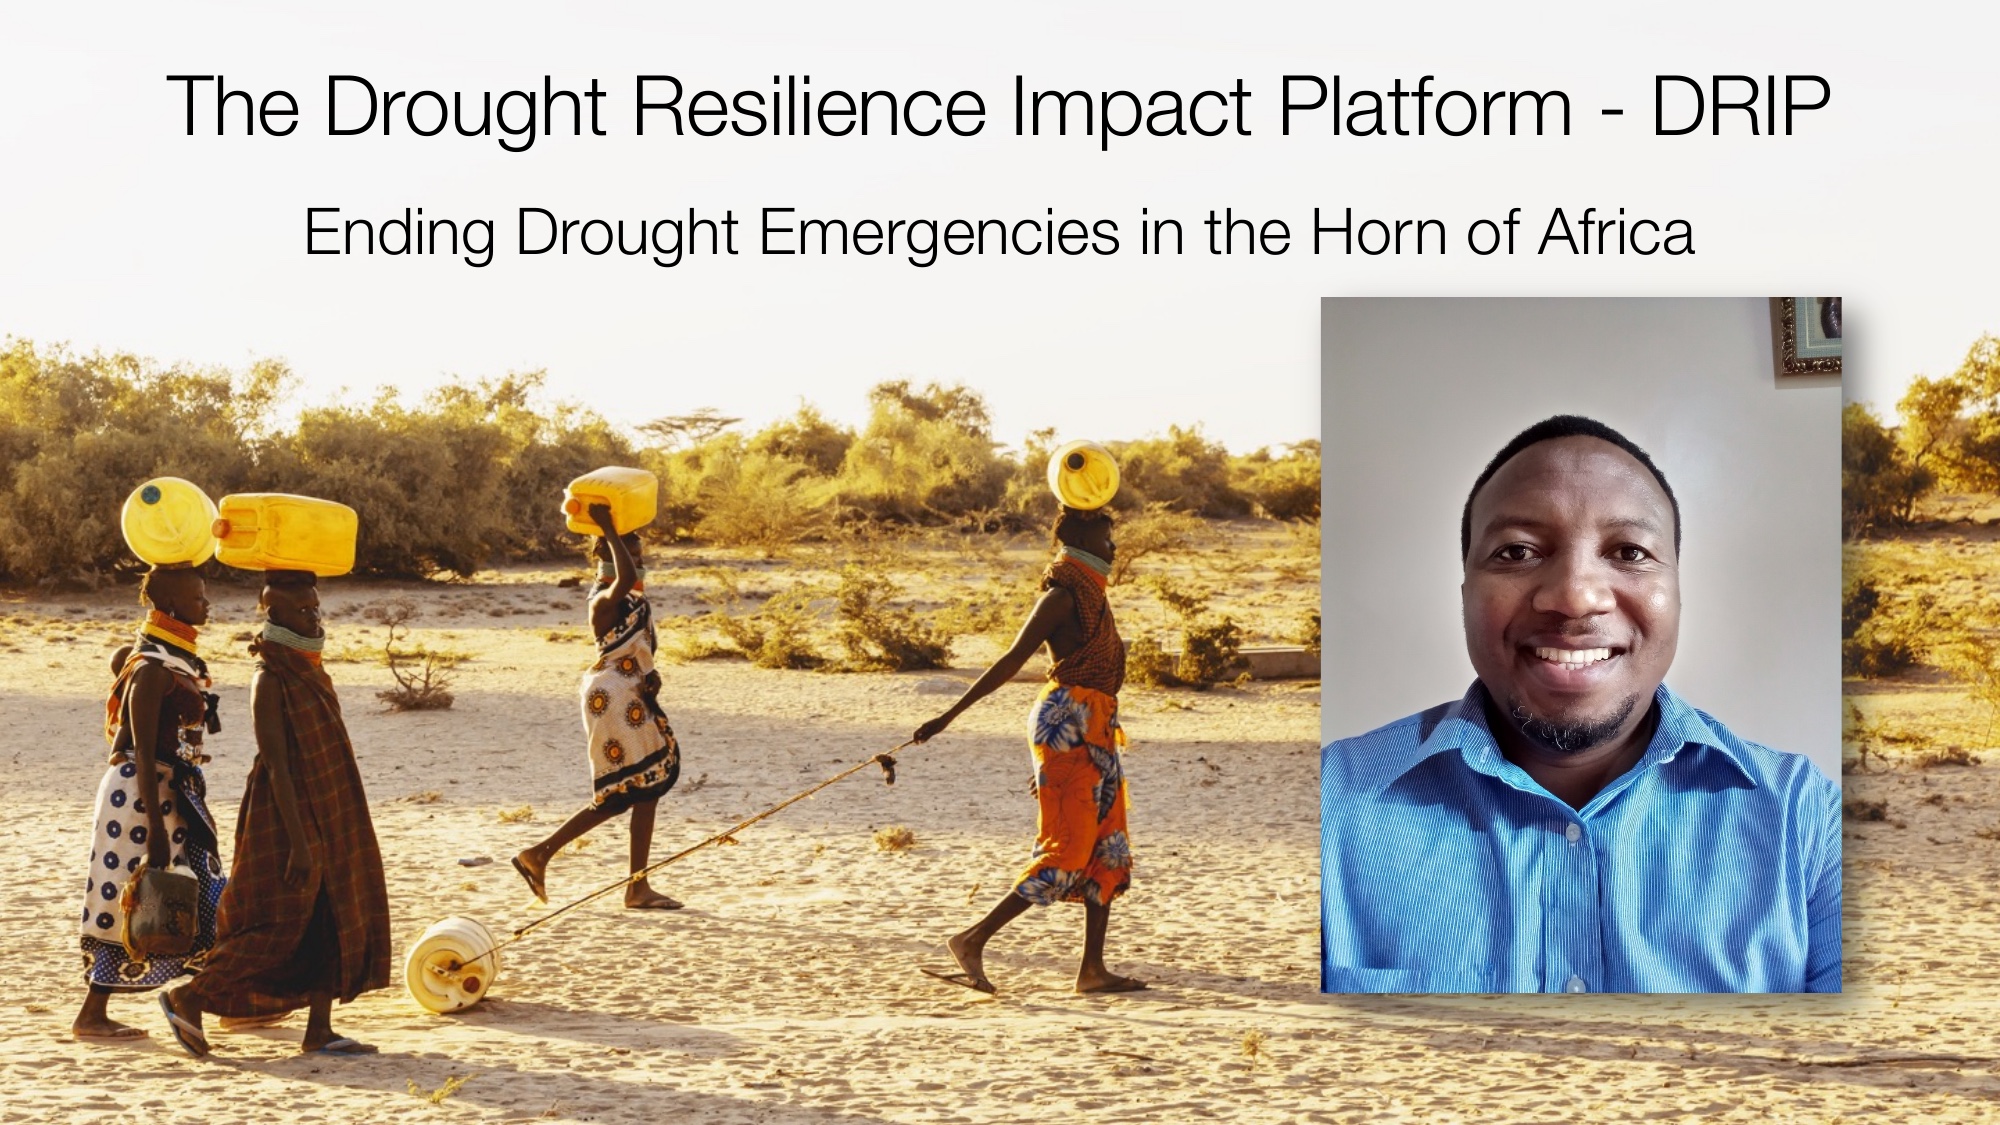
Meanwhile, in places like East Africa, another 40 million people are facing the risk of famine because of what was then the sixth consecutive season of drought. The people in these photos — the women walking miles to collect water, the children at the pumps — are living the direct consequences of a climate they did not create. This is the fieldwork. This is where the data has to come from. Every sensor we deploy here is one data point in a continent that has almost none.
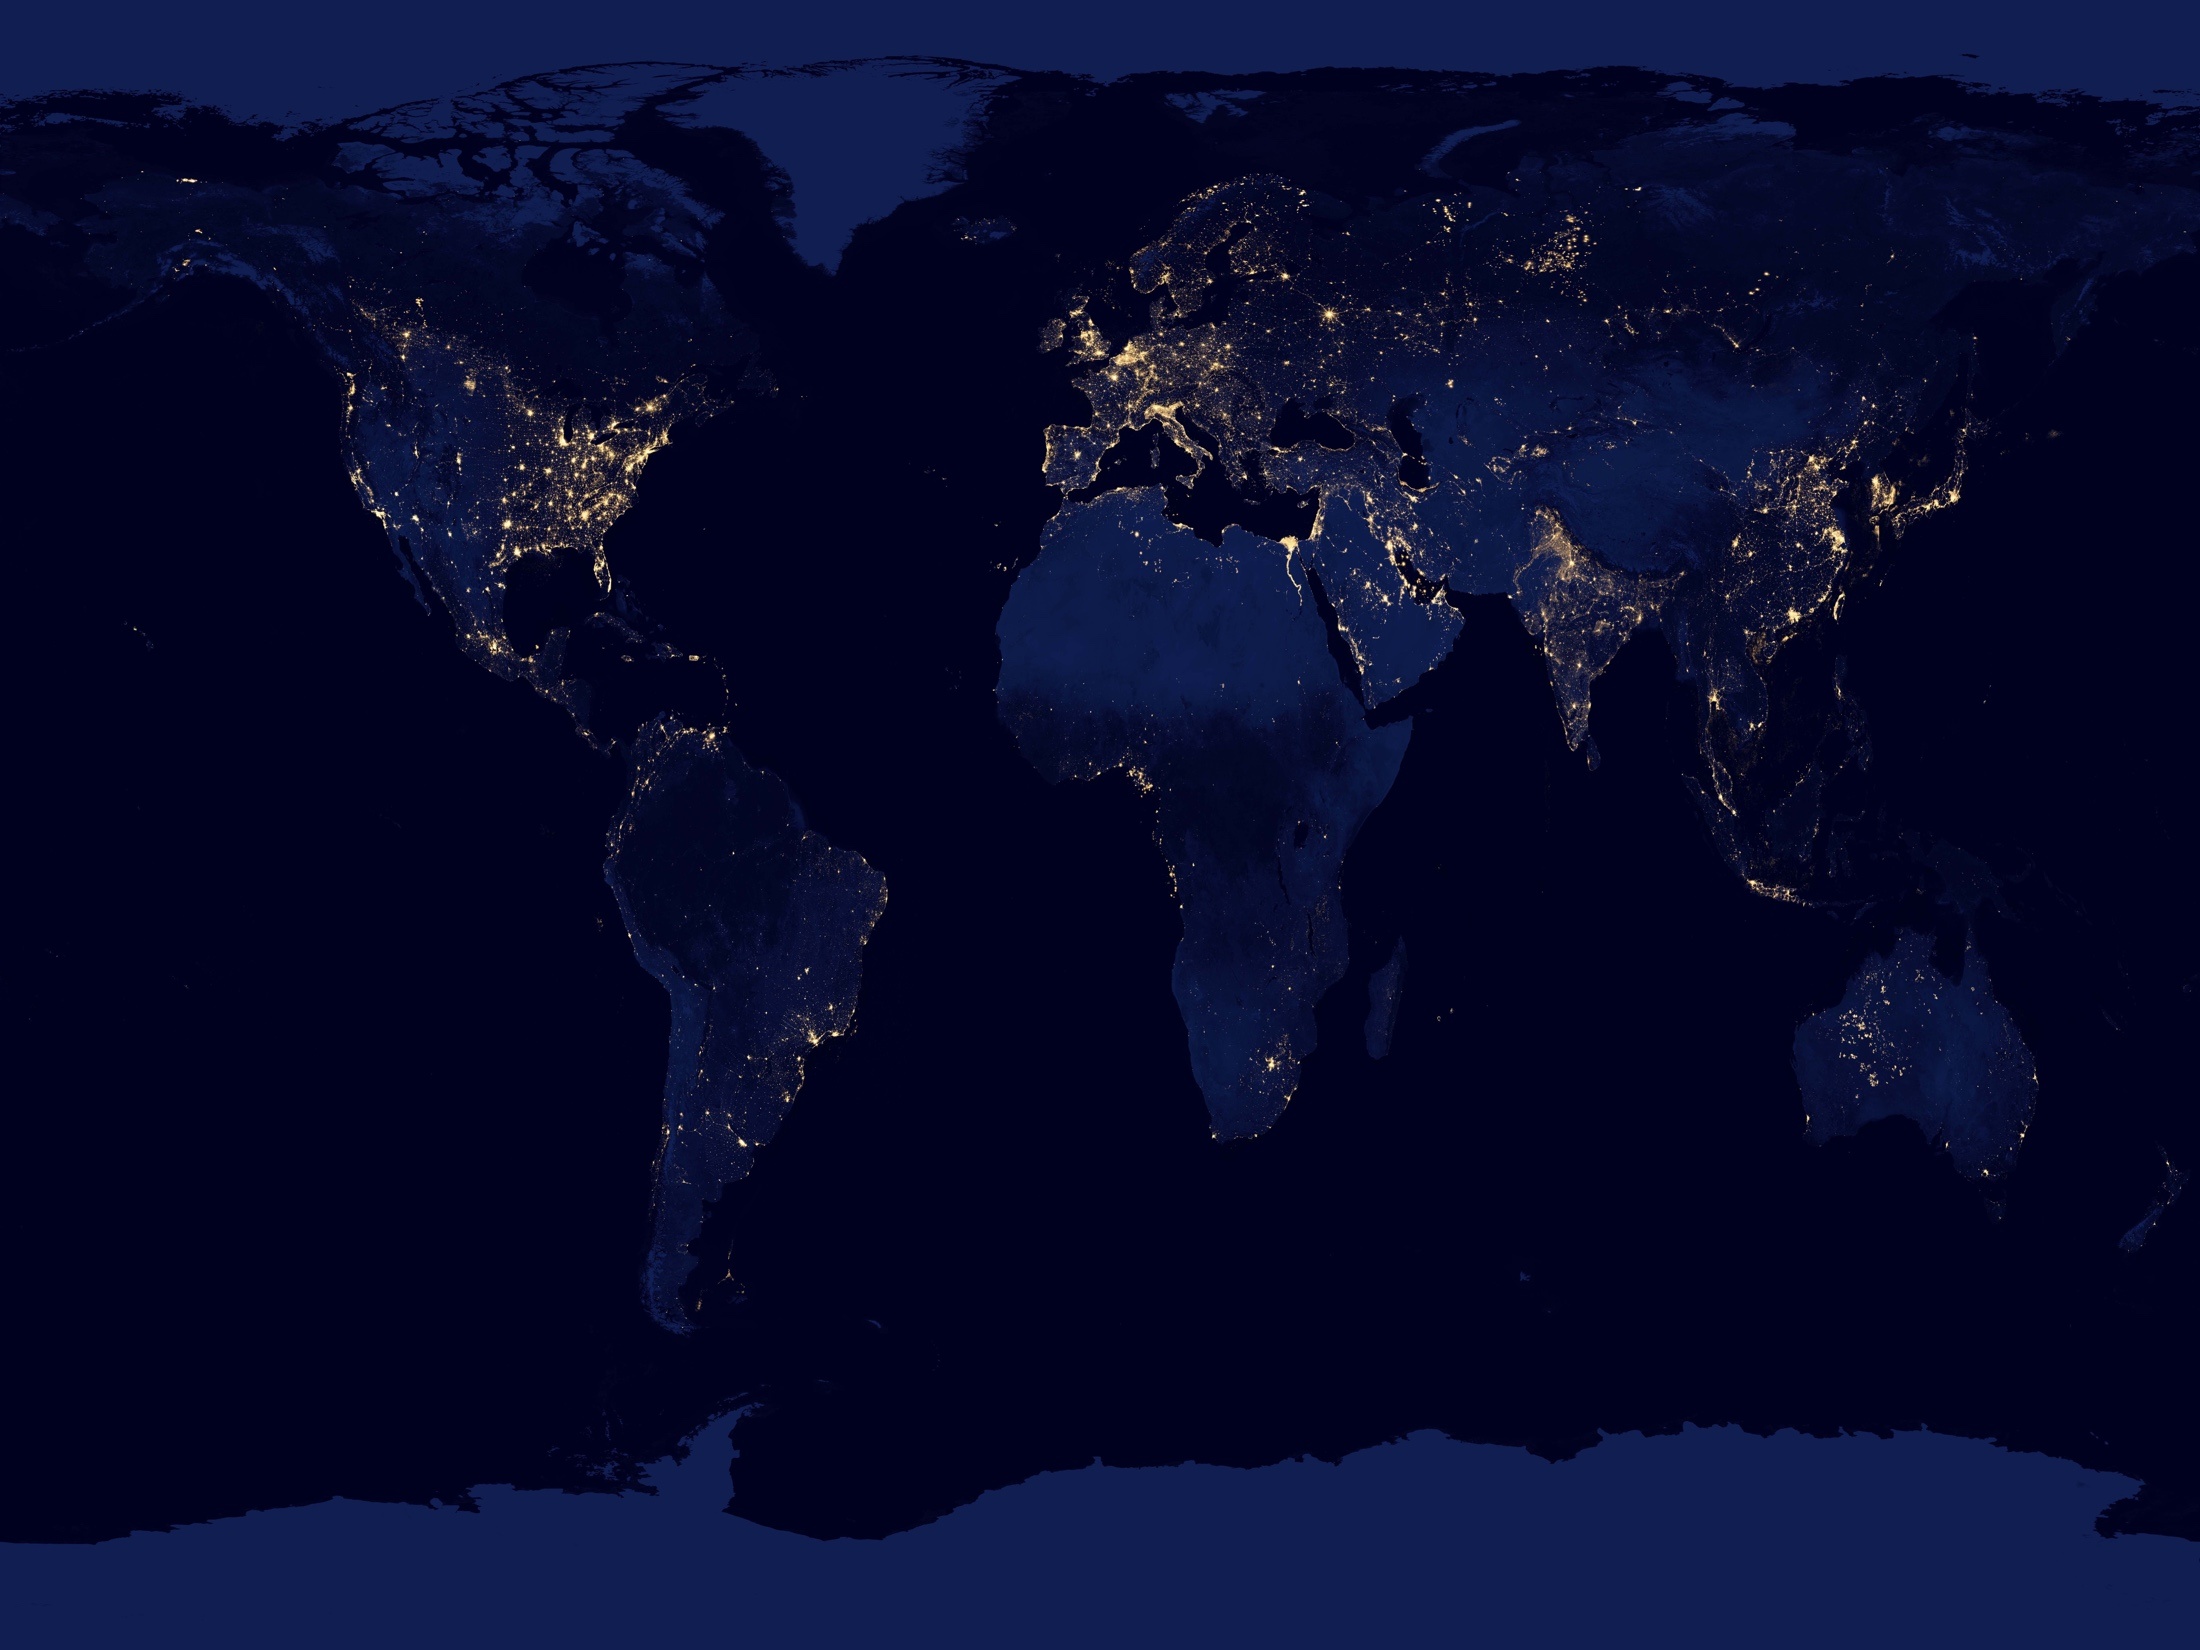
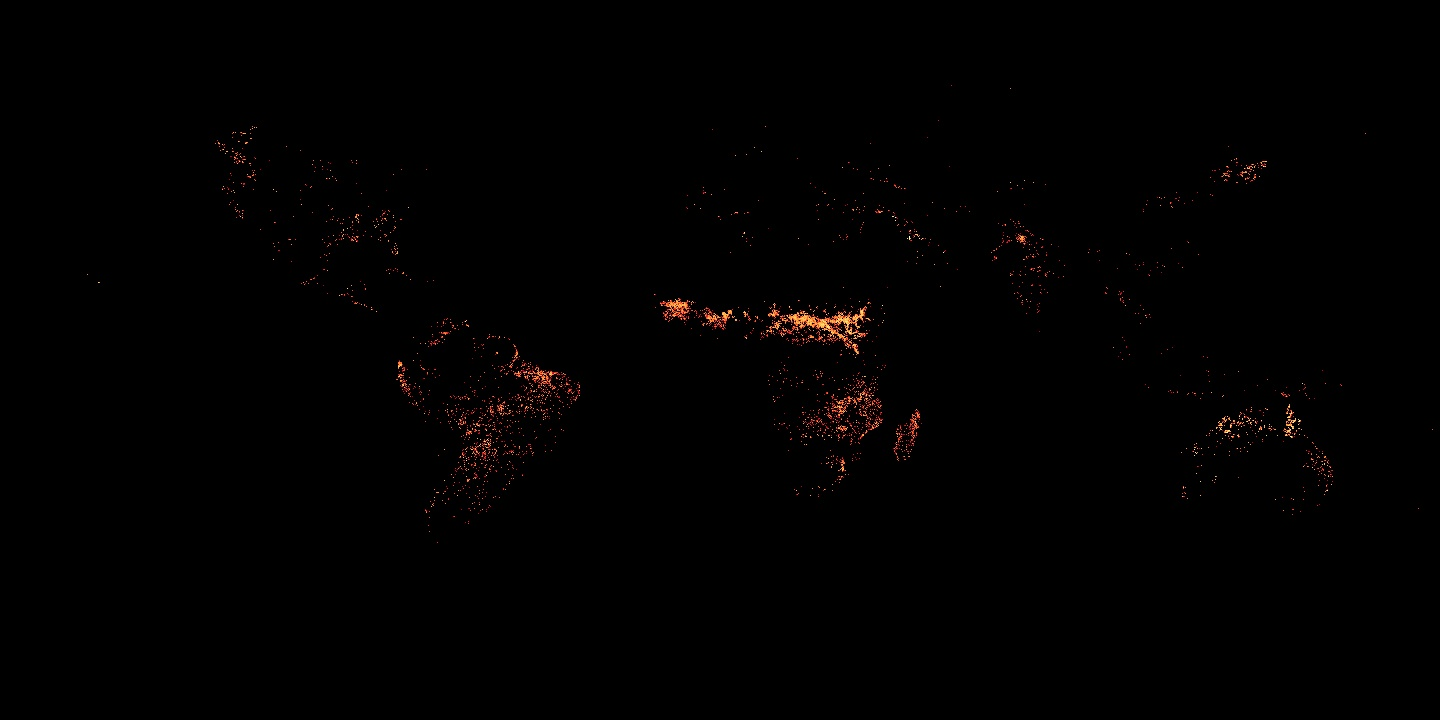
Think of this map the way you think about the Earth at night seen from space — the bright spots show you where rich people live, not where people live. This water quality map is exactly the same. The dense clusters of measurement data show you where wealthy countries have invested in monitoring infrastructure. Over three billion people, nearly half the world's population, use firewood every day for cooking and staying warm. This is also where they live — and it's almost invisible on this map. These are the people facing the earliest and worst effects of climate change on their water, and they are almost entirely unmonitored.
This is how the global WASH sector has thought about clean water for fifty years. You raise money — from donors, governments, sometimes private capital. You buy hardware: water filters, hand pumps, cookstoves, solar systems, latrines. You hand it to families. You hope they use it. Outcome: better health. That's the conventional model — linear, one-shot, hope-based.
It is also why the global WASH sector has been struggling for twenty-five years. Hardware gets distributed; nobody knows if it works in practice; the next round of funding asks the same questions. The piece this picture is missing is what comes next.
The big idea is to take the fast-growing world of climate finance — things like carbon credits — and turn it toward solving water problems. A carbon credit is a financial commodity worth about $20 today, representing a tonne of CO2 removed or not emitted. There's a multi-billion dollar market for carbon credits, and it's growing fast.
Carbon credits work because the atmosphere mixes — it really is legitimate to reduce emissions in one place to offset energy use in another. This hasn't been true for water. Save water in Colorado, it does nothing for Rwanda. But if you create a financial instrument that rewards water conservation in Colorado or water treatment in Rwanda, that credit becomes part of a liquid market. It can be bought and sold and create revenue that incentivizes the actions we all need to take. Monitoring closes the loop — you can only pay for outcomes you can measure.
The Drinking Water Credit Model
Credit Economics
Cost to first issuance
2–3 year timeline. $5–$10/tCO2e credit price. Sales margins 10–50%.
Executed offtake contracts
PetroChina, Louis Dreyfus, WEF, Mortenson. Contracted through 2031.
tCO2e issued to date
680K+ credits/year by 2030. 5.6x cost-benefit ratio. 29–49% diarrhea reduction.
Digital MRV
IoT-verified credits eliminate the 36–40% self-reporting bias found in traditional household surveys.
Lume Sensor
- TLF-based E. coli detection
- ML contamination risk classification
- Gold Standard DMRV pilot approved
IoT Gateway Network
- Satellite-connected monitoring
- Repair time: 214 → 26 days
- Functionality: 56% → 91%
ML Analytics Platform
- Automated credit quantification
- Transparent, auditable records
- Reduces MRV costs across portfolio
High Integrity Water Projects Across Africa
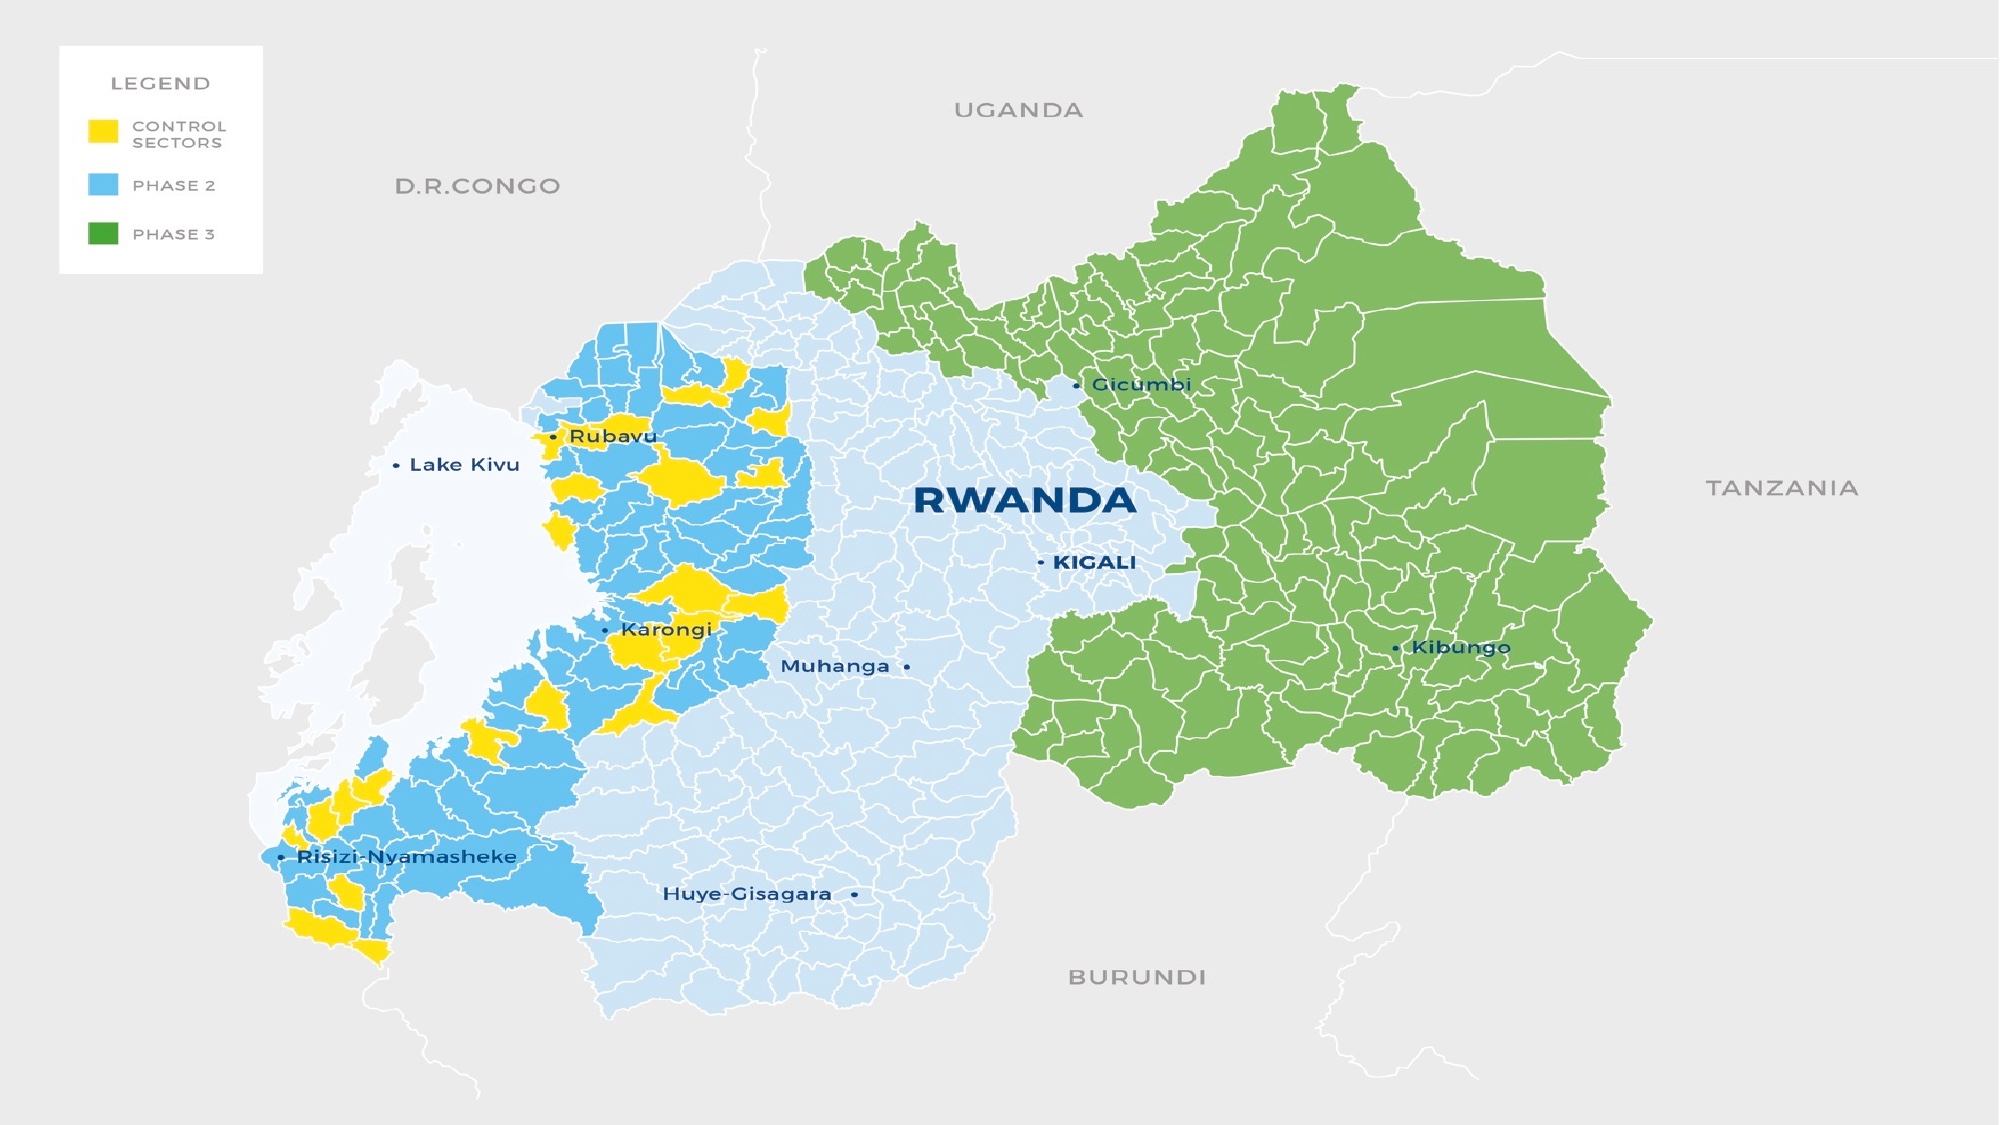
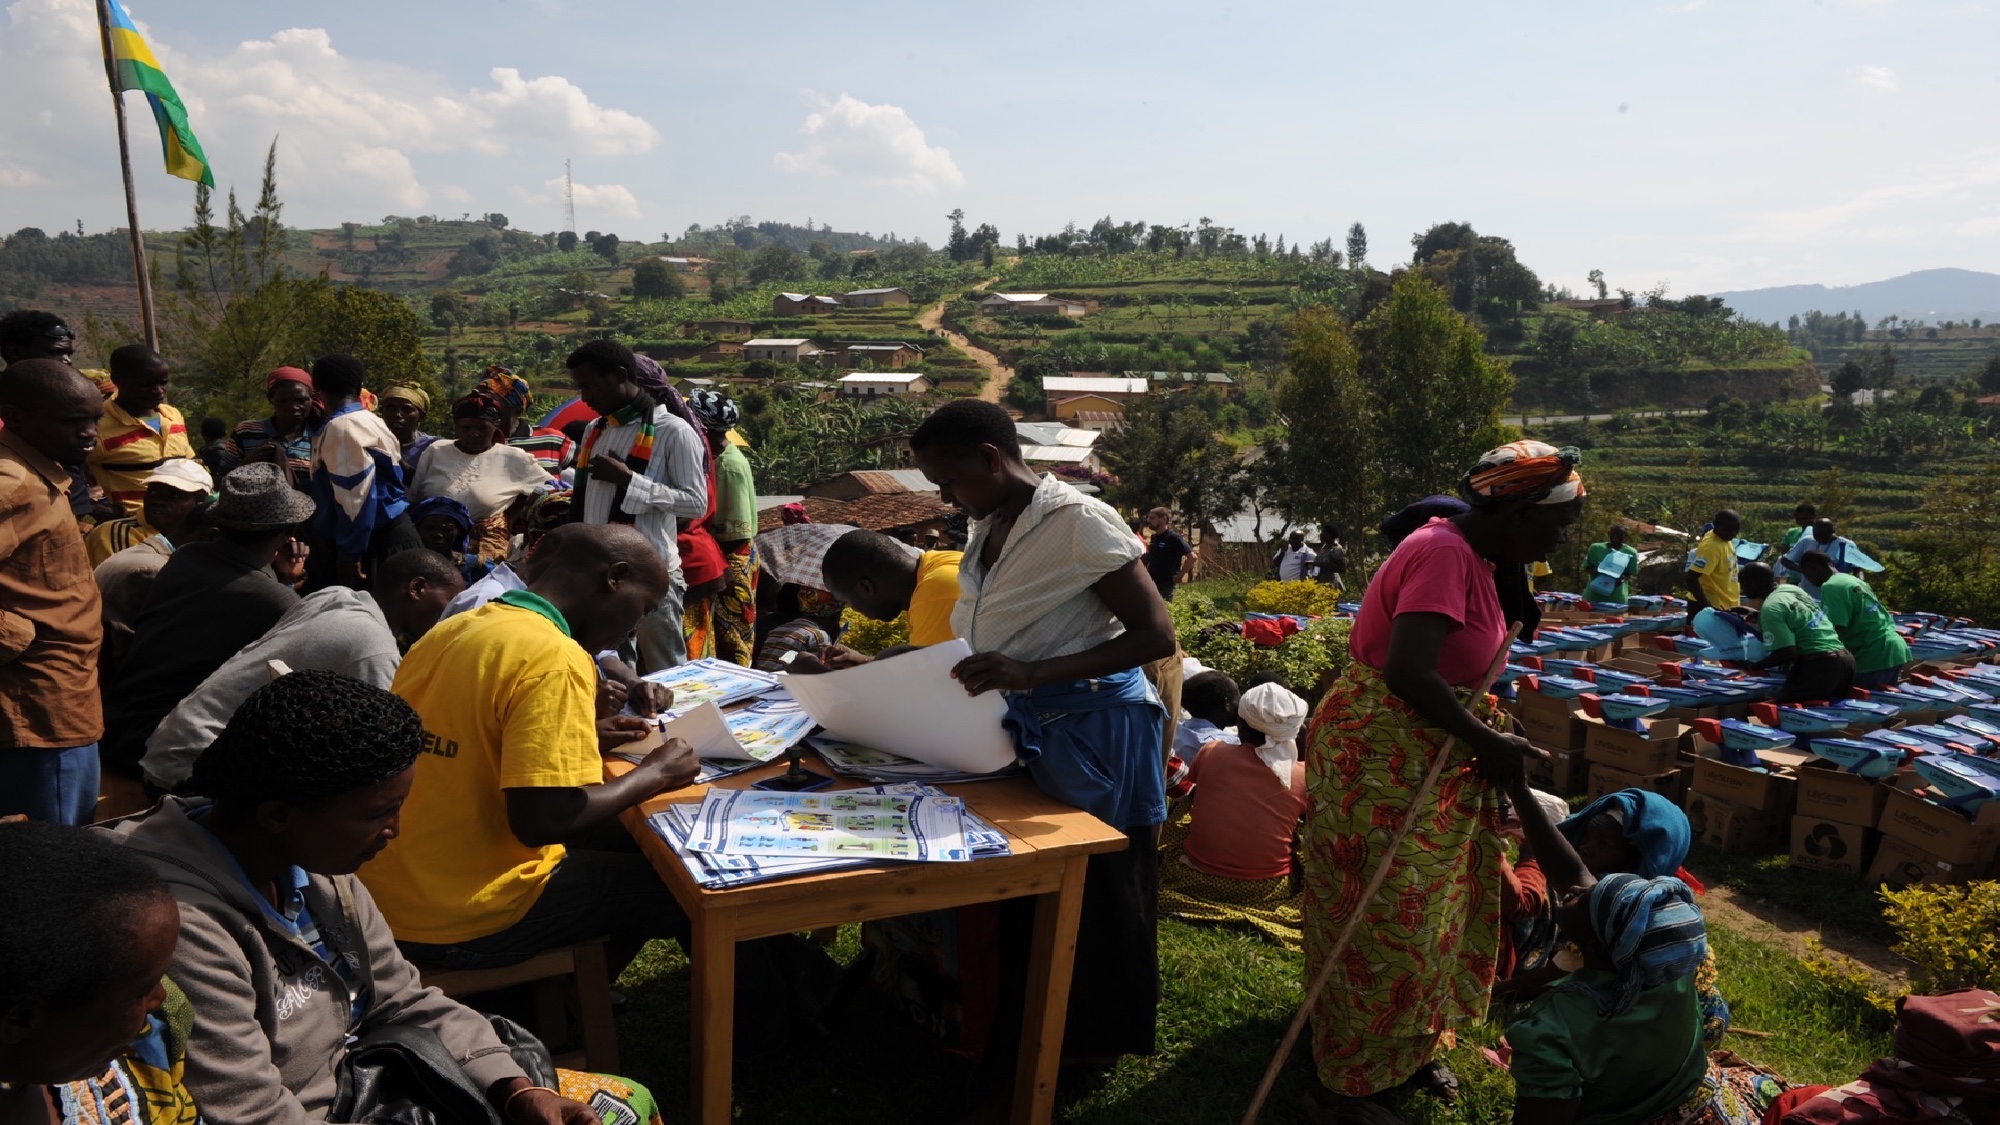
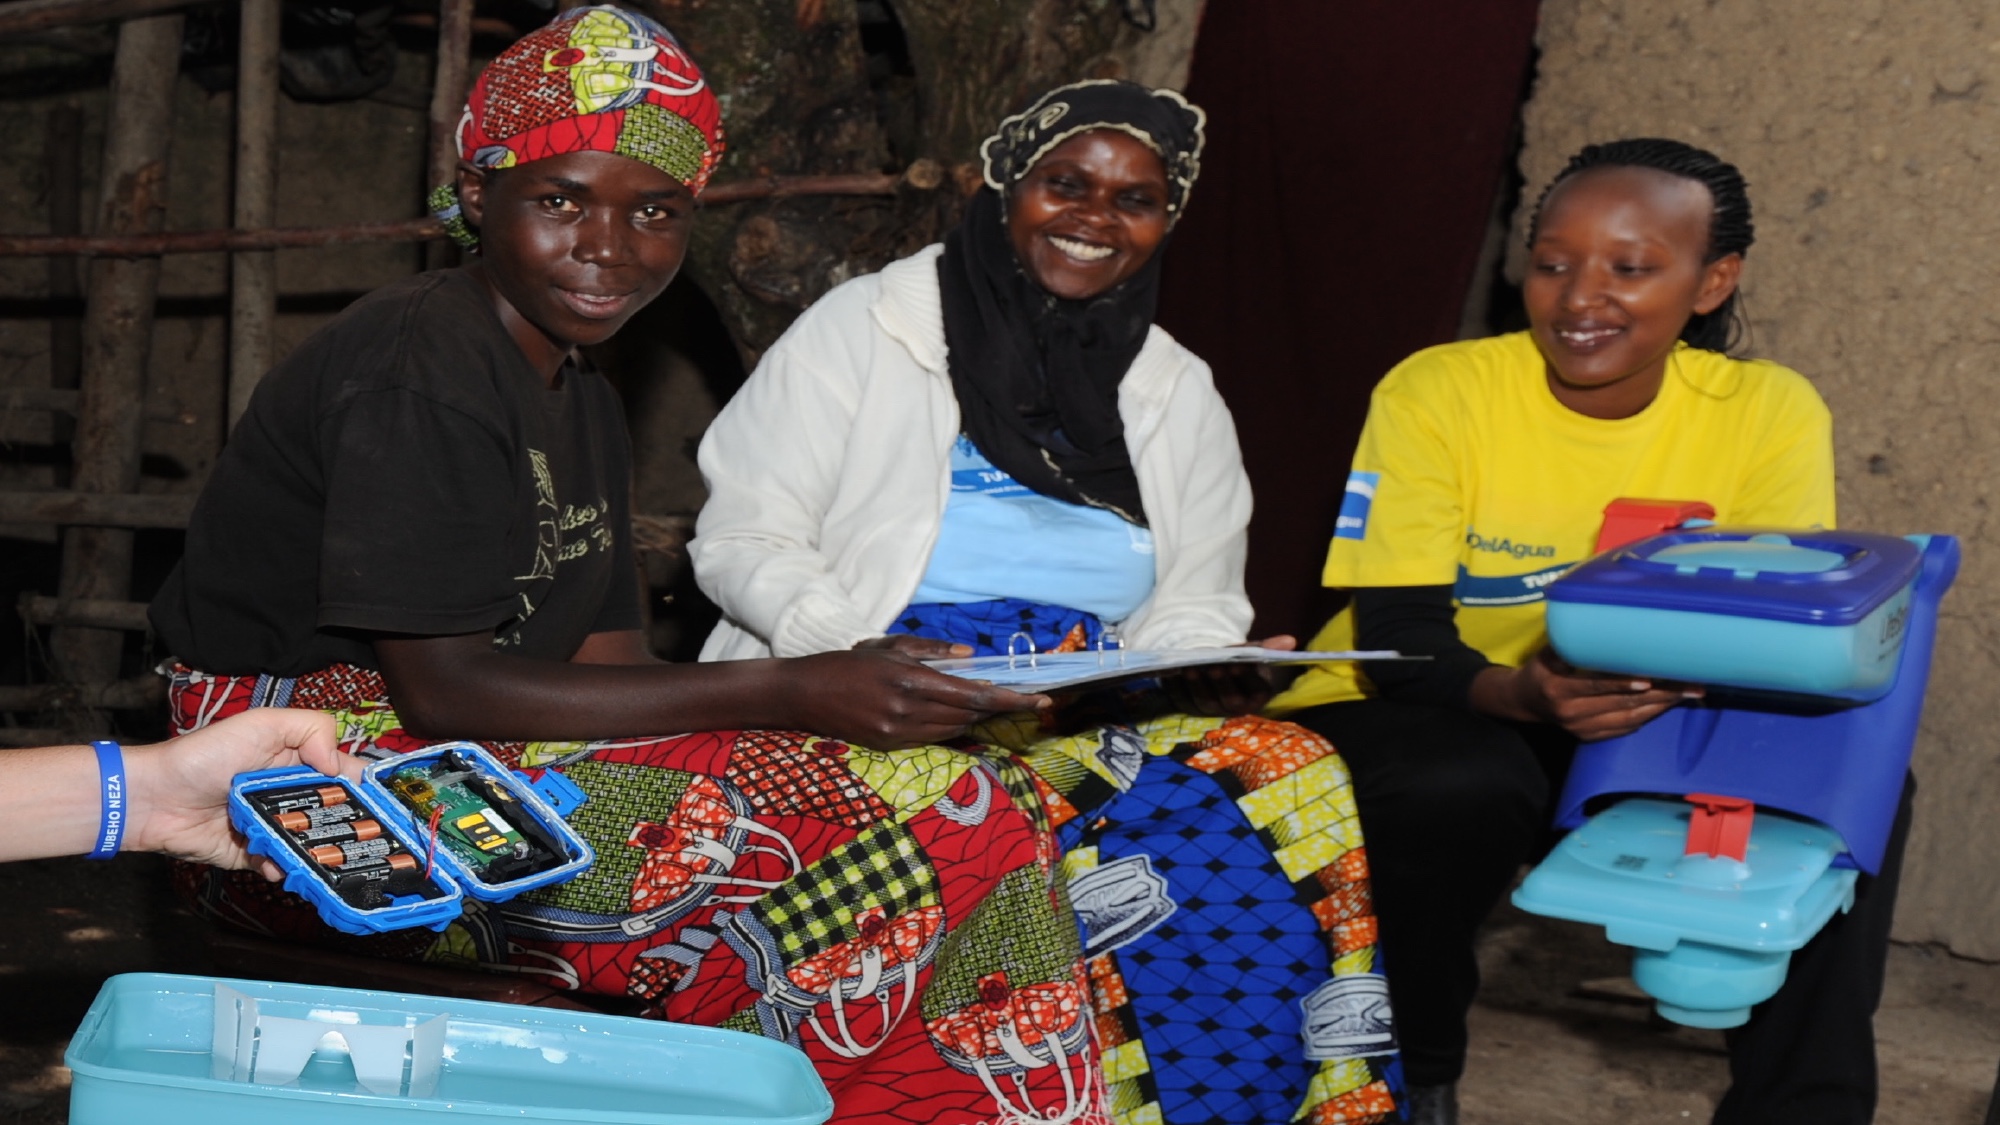
These programs have reached over five million people with clean water, and mobilized over $70 million in private and public investment — from venture capital, carbon credit buyers, NASA, and USAID — while generating over $100 million in returns. People are getting clean water in places where governments and donors can't reach. Investors take a risk, millions of people benefit, and companies see a modest return. That's the model.
These carbon credits are also a form of climate reparations. We caused climate change. People around the world are now feeling its effects. By taking money from carbon-emitting corporations to provide a basic water service, we are using capitalism to repair water supplies damaged by capitalism. The numbers on this slide are what that looks like in practice — not in theory.
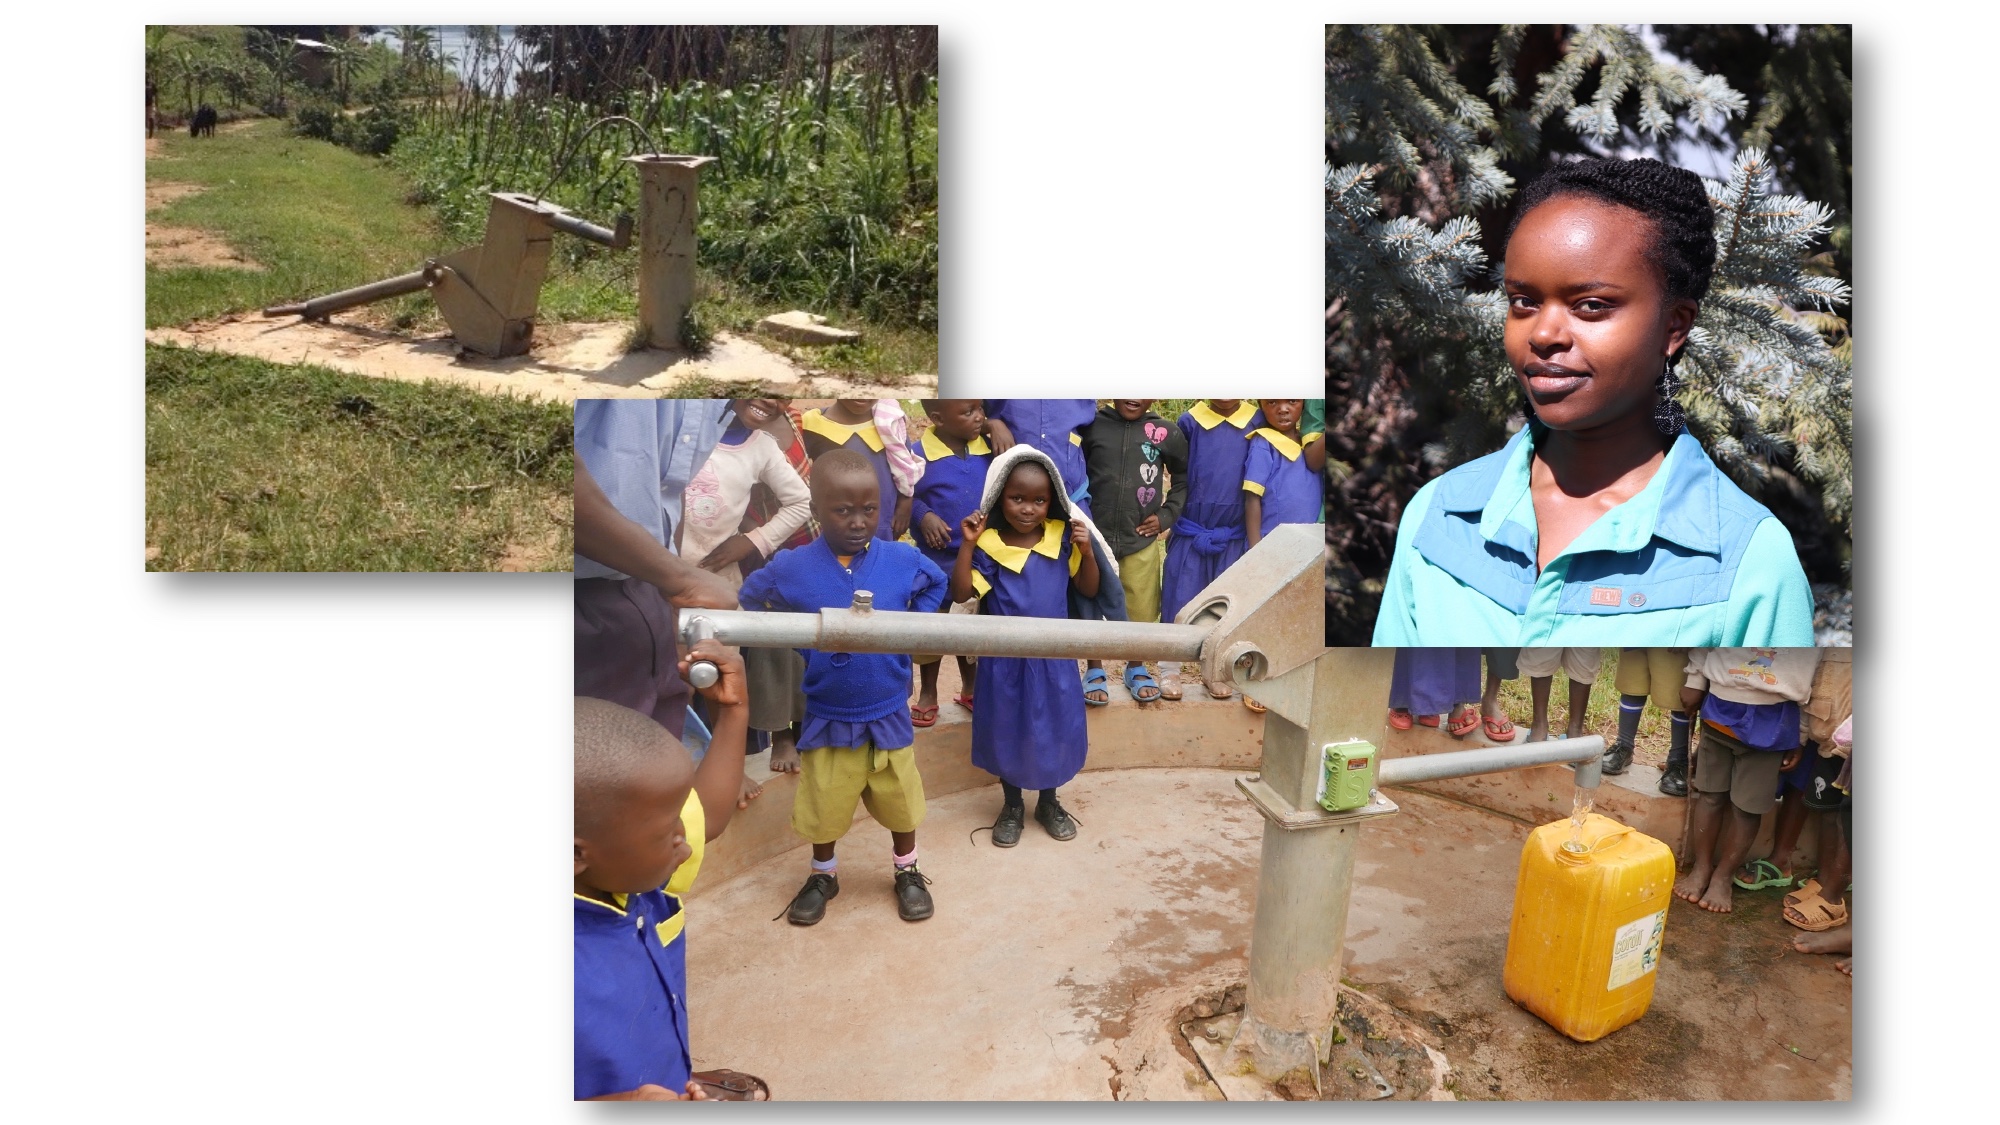
& Service Interval
In 2007, I started a company to get water treatment to families who relied on untreated water in Rwanda and Kenya. We were the first company to register with the United Nations to earn carbon credits for treating drinking water anywhere in the world. Some people boil their water; most people just drink dirty water. We earned carbon credits — and therefore revenue — by reducing demand for firewood used to boil water. That revenue paid for the water service on an ongoing basis and repaid investors.
These programs have so far reached over five million people with clean water, and mobilized private and public sector investments from venture capital, carbon credit buyers, NASA, and USAID of over $70 million, while generating over $100 million in returns for investors and as investment in communities. People are getting clean water in places where governments and donors aren't able to reach.
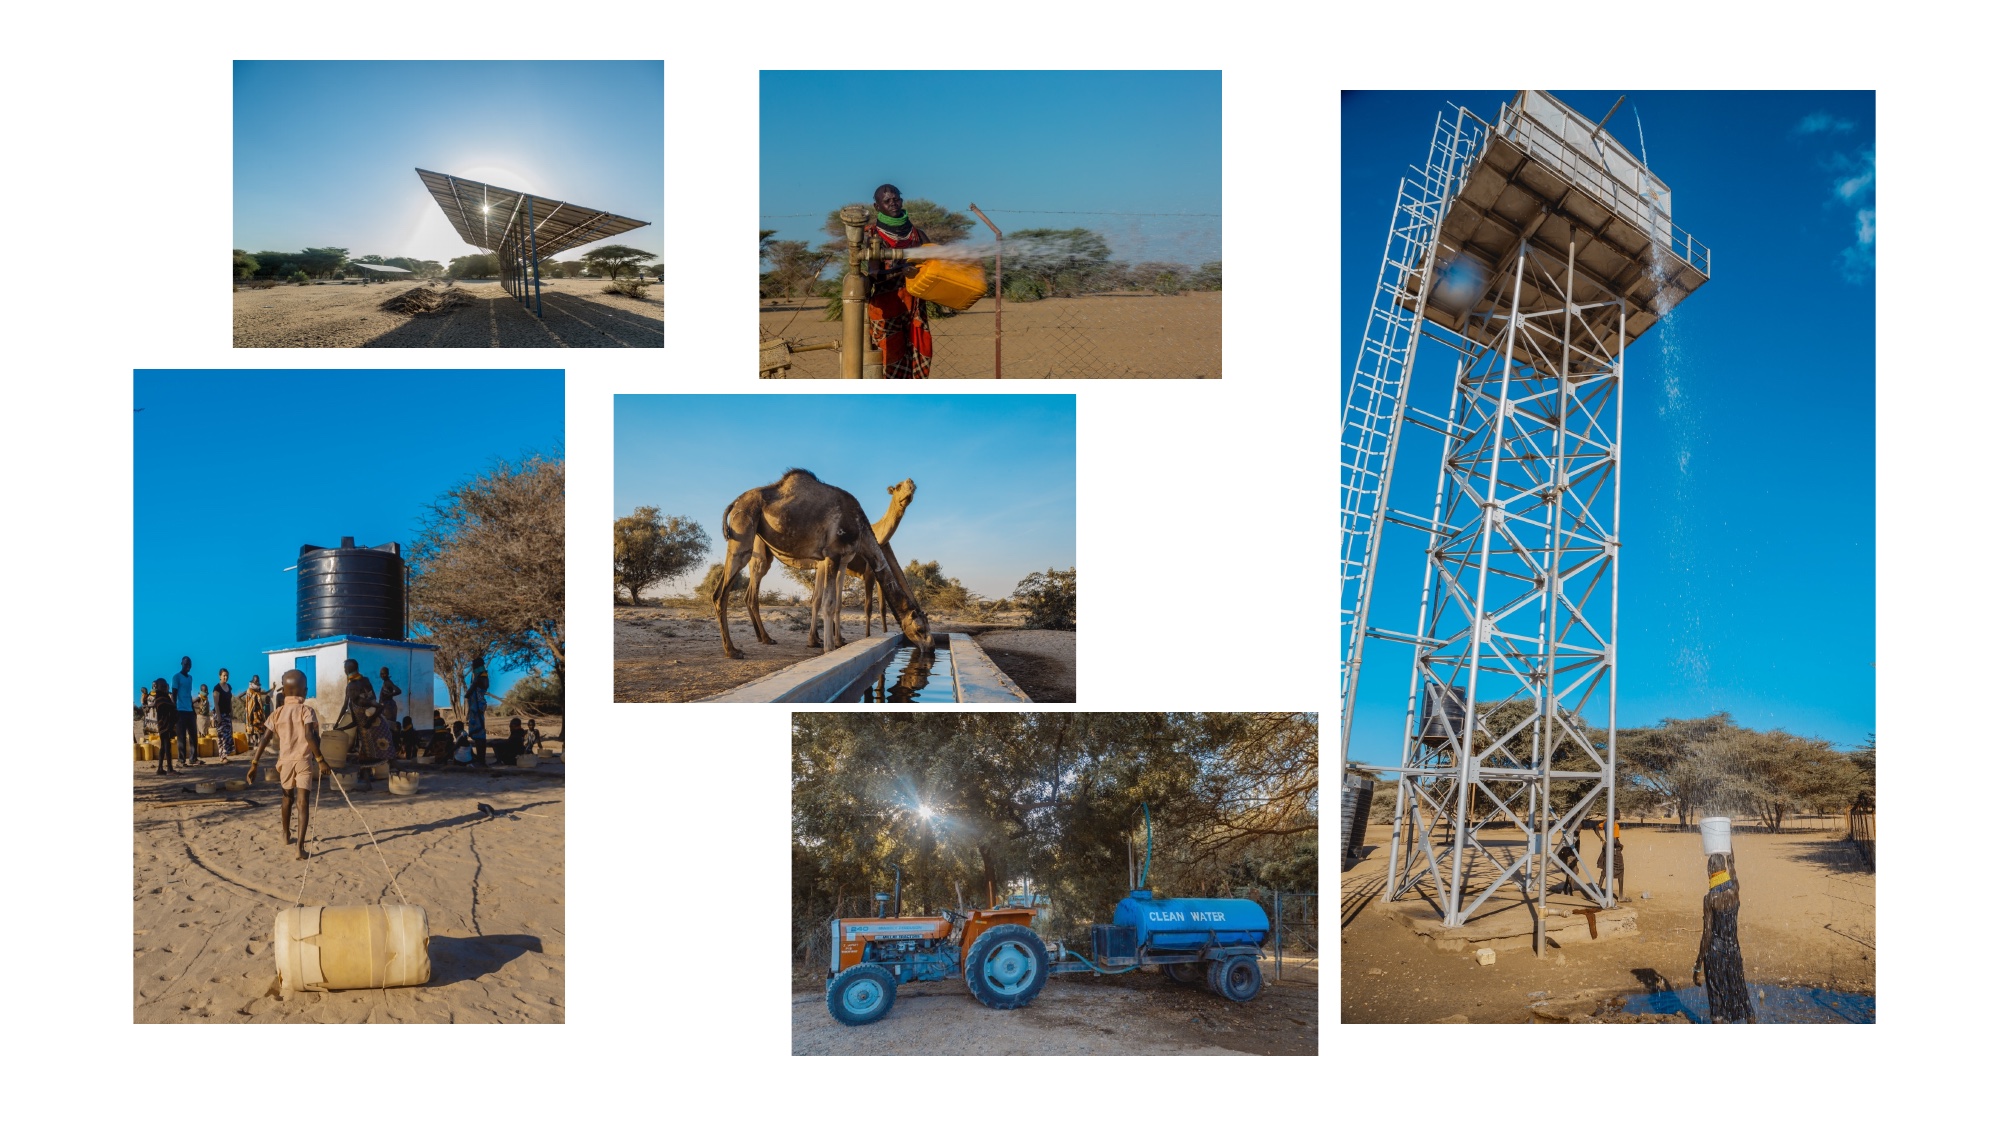
Forecasting Groundwater Demand from Space
69 IoT sensors + satellite data + 19-algorithm ML ensemble — Kenya ASALs. Science of the Total Environment 831 (2022) 154453.
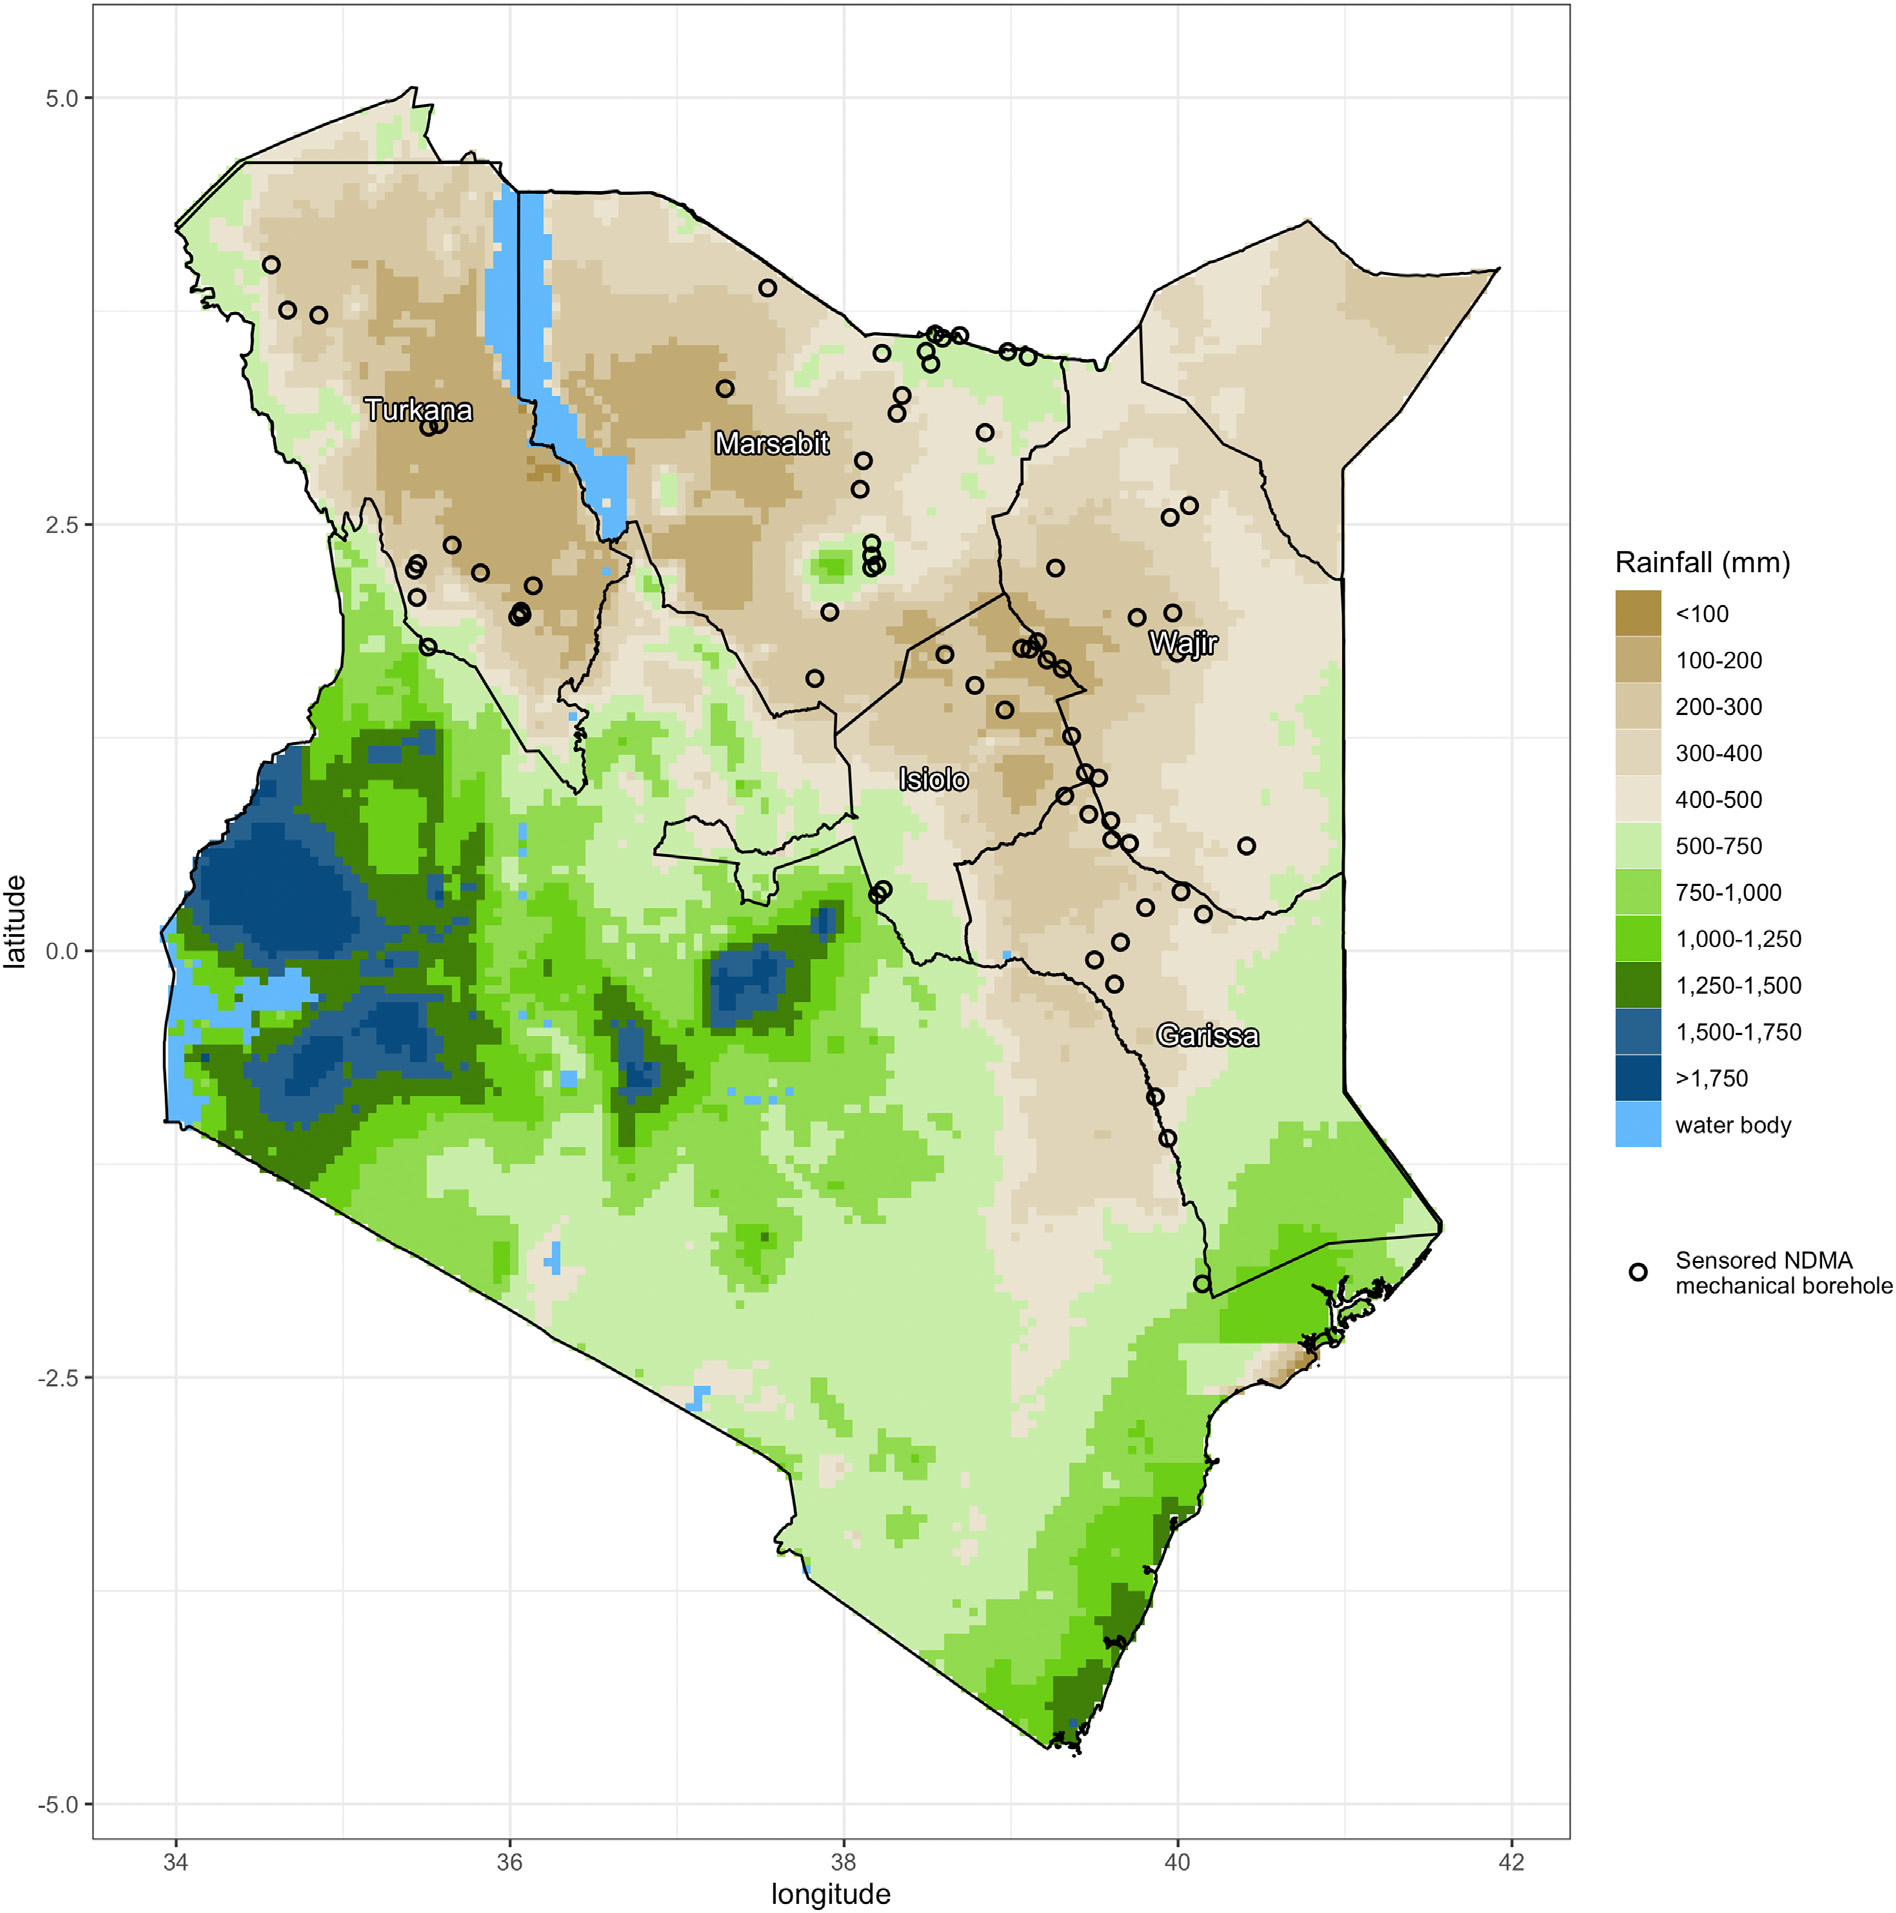
Fig. 1 — 69 sensored NDMA boreholes (open circles) across 5 ASAL counties, 260,000 km². Mean annual CHIRPS rainfall shown.
Predicted probability of high demand (>75 L/p/d) — Jun–Sep 2021
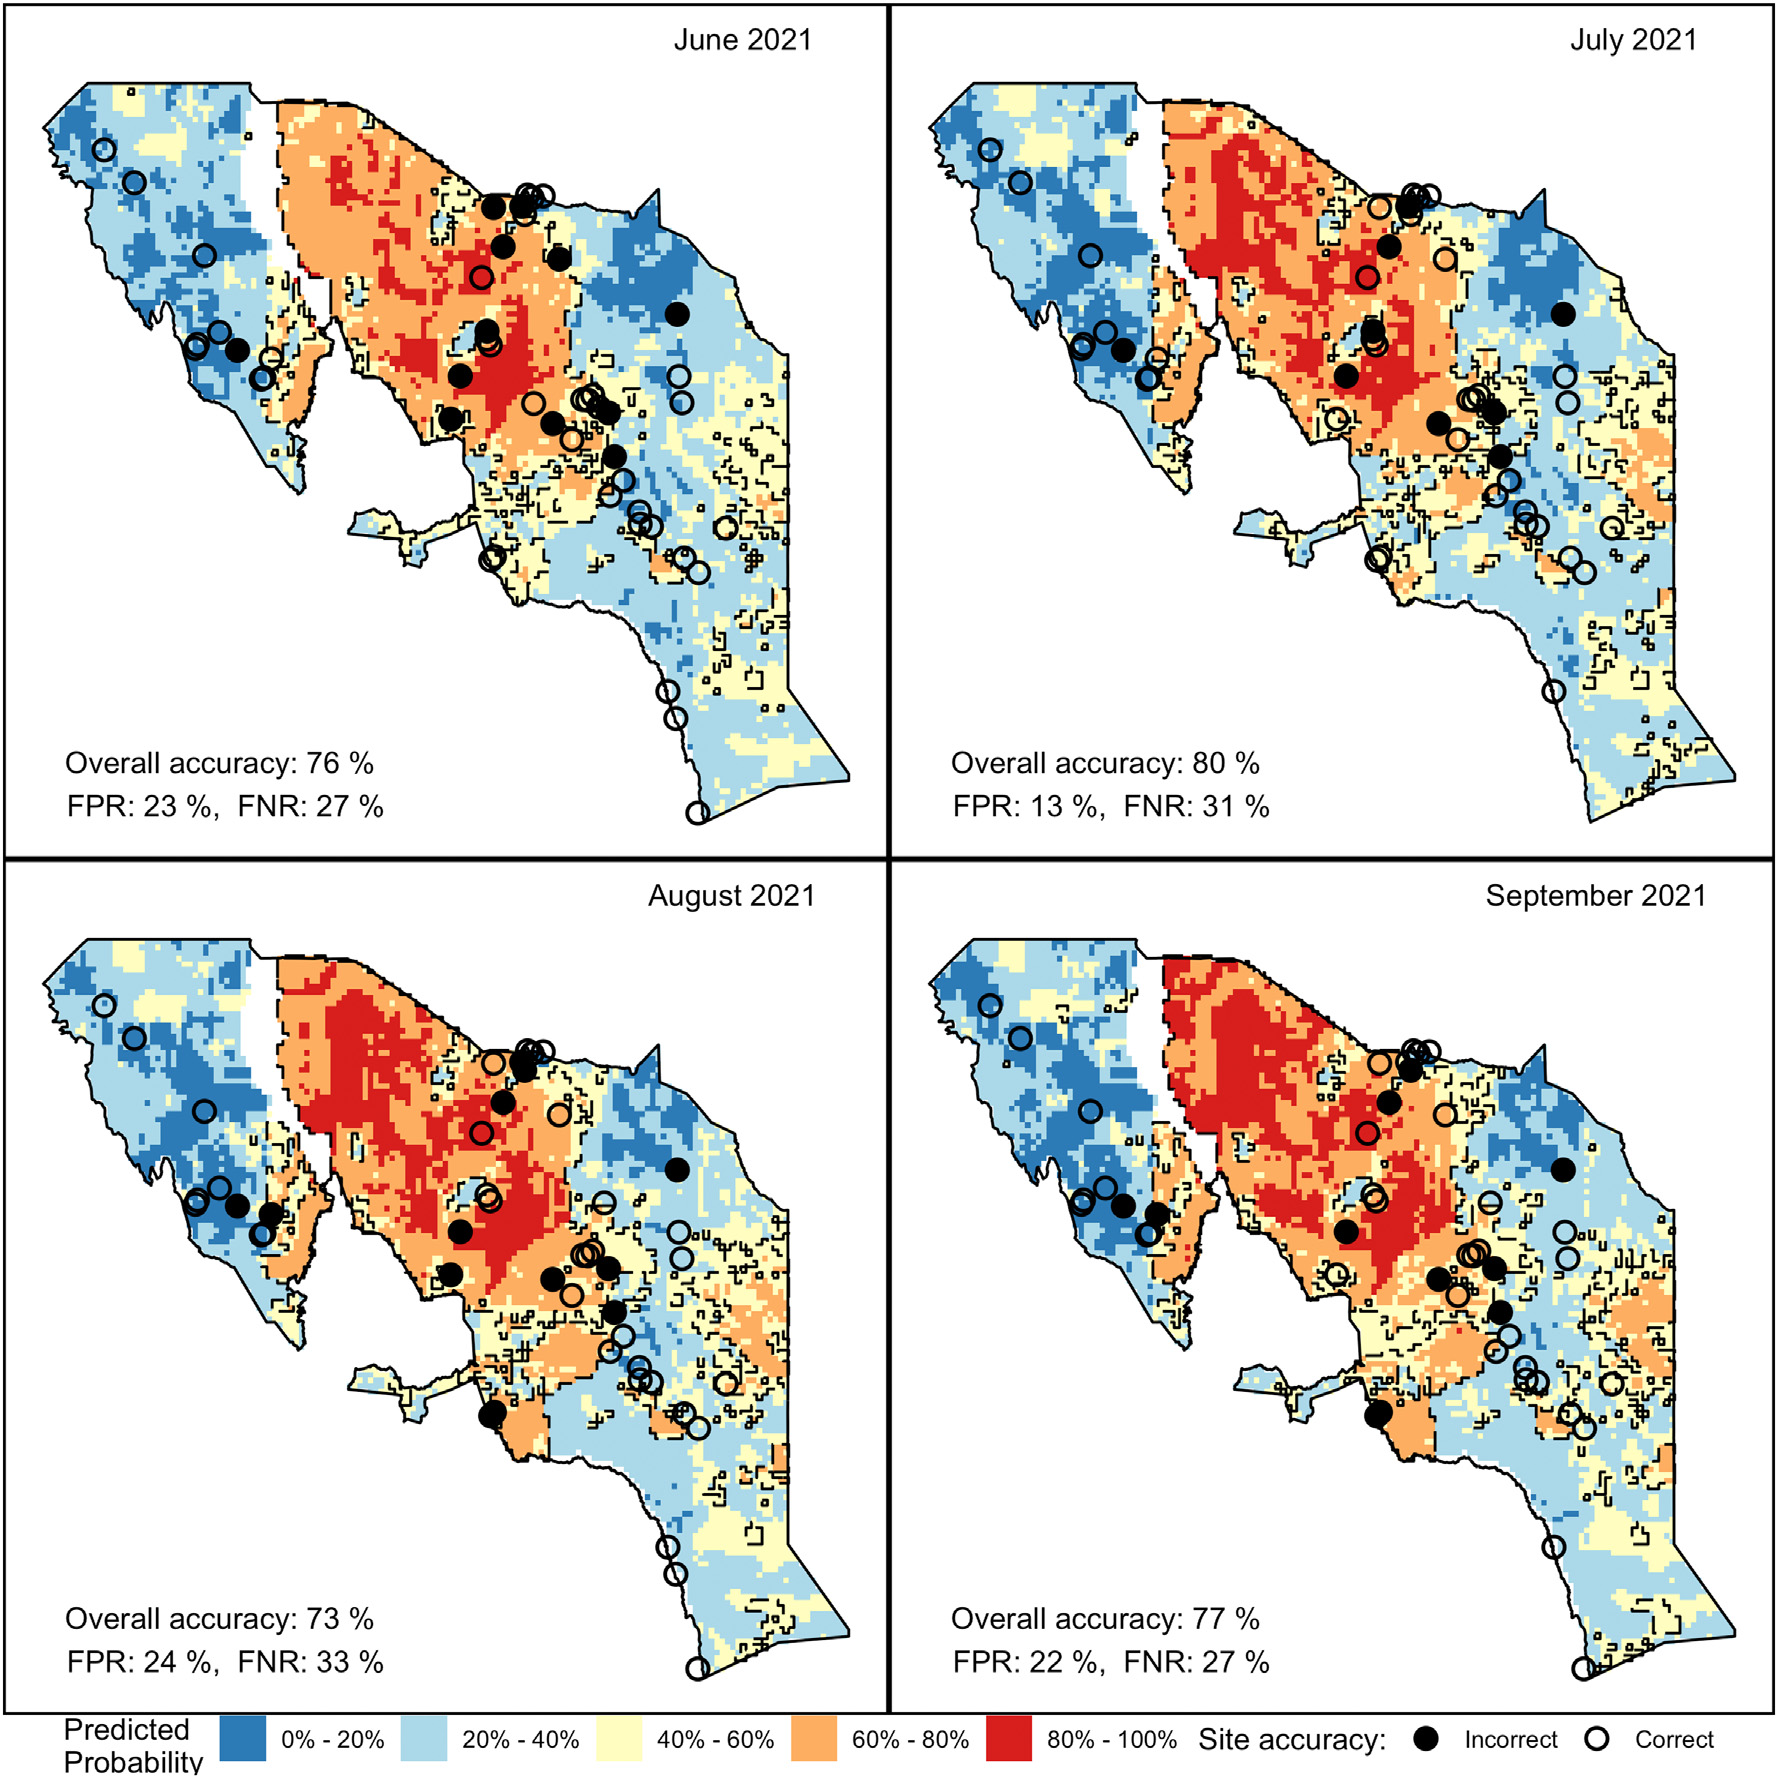
Fig. 3 — Red = high probability of demand exceeding 75 L/p/d; white/pale = low probability. Open circles = correct predictions; filled = incorrect. Overall accuracy 73–80%. Now adopted by FEWS NET & Kenya NDMA for drought early action.
Meet the Lume
The first continuous, field-deployable E. coli proxy sensor — built on deep-UV fluorescence and on-device machine learning.
- Deep-UV optical excitation at 280 nm targets tryptophan-like fluorescence — a direct proxy for fecal bacteria, not a surrogate of a surrogate
- Three interchangeable modes: TLF (E. coli), Cl-A (algae/HABs), FDOM (dissolved organics) — same hardware, swapped optics
- On-device ML anomaly detection learns site-specific baselines and flags contamination without fixed thresholds — US Patent 11,506,606 B2
- 91–92% classification accuracy at regulatory thresholds; Cohen’s κ = 0.82–0.84 against Colilert reference method
- No calibration required — optical design and ML together eliminate the drift-correction burden that has blocked continuous WQ sensing for decades
Bedell, Fankhauser, Sharpe, Wilson & Thomas — CU Boulder / Virridy
Field Testing the Lume
Researchers deploying the Lume sensor in natural stream environments for real-time E. coli monitoring and validation studies.

Seine River, Paris
Virridy’s Lume sensors monitoring water quality for recreational swimming safety along the Seine River.
Rural Water Access, Kenya
Monitoring borehole water points in arid pastoral regions. IoT sensors verify functionality and usage for carbon credit verification.
Clean Water in Schools
LifeStraw water purifiers monitored by Virridy sensors in classrooms across Kenya — supporting access to safe drinking water and verified carbon credits.
Drinking Water Classification
The Lume has been validated for drinking water monitoring across chlorinated and unchlorinated supplies. Binary classification at regulatory thresholds of 1 and 10 CFU/100 mL yields 91–92% overall accuracy with Cohen's kappa of 0.82–0.84.
Confusion matrices for binary classification of water quality using sensor predictions versus laboratory-observed E. coli concentrations at two regulatory thresholds.
Natural Waters — Local Model
The Lume algorithm has been extensively validated against Colilert E. coli in freshwater systems. Over 75% of predictions fall within the analytical uncertainty bounds of the Colilert reference method, with 7% MAPE in log-transformed space.
Left: Boulder Creek test dataset. Right: Categorical classification into three management-relevant bins (<10, 10–100, >100 MPN/100 mL). Balanced accuracy 95%, Cohen's kappa 0.84.
Every SDG Needs Measurement
Different goals, different sensors, different data — same logic. Continuous, auditable measurement is the precondition for anyone being held accountable for outcomes on any SDG.
& Sanitation
& Well-being
Action
Energy
Innovation
Inequalities
Land
for the Goals
Global Water Security
Analytics to Action
Contact
Evan A. Thomas, PhD, PE, MPH
Director & Professor — Mortenson Center in Global Engineering